Download
1 / 56
570 likes | 684 Vues
Bob Howarth Cornell University Scientific & Technical Advisory Committee Chesapeake Bay Program Annapolis, MD June 8, 2011. Greenhouse Gas Emissions from Shale Gas: Is this a “Clean” Fuel?.

E N D
Bob Howarth Cornell University Scientific & Technical Advisory Committee Chesapeake Bay Program Annapolis, MD June 8, 2011 Greenhouse Gas Emissions from Shale Gas: Is this a “Clean” Fuel?
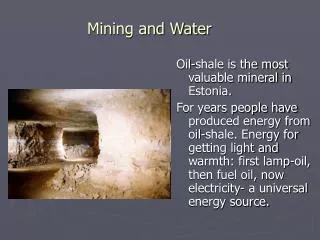
Shales hold a lot of natural gas (methane), but very dispersed, not economical using traditional technology…… Within last 4-13 years, horizontal drilling and high-volume, slick-water hydraulic fracturing (“hydrofracking”). Source: JUNEX -- http://www.searchanddiscovery.com/documents/2009/80073marcil/ndx_marcil.pdf
Unconventional extraction of gas from shale formations is new, and is being promoted globally by U.S. government and industry • Argentina • Australia • Canada • China • Denmark • Germany • India • Poland • South Africa
Hydraulic fracturing has been used to increase flows from conventional gas formations for decades….. But relatively small amounts of water used (< 300 m3).Hydraulic fracturing for shale gas is new: past 13 years in Texas, past 3-4 years in Pennsylvania.For hydraulic fracturing in shales, large volumes of fluid used for each well (60,000 m3 and more).Often have 6 to 16 lateral wells per each surface site (so up to 960,000 m3 of fluid per site).Large volume and long horizontal wells require additives to reduce friction of the water (slick water). Additives also added to prop fractures open (“sand,” plastics), perforate well casing, prevent bacterial growth, and other purposes.A large volume of hydrofracking fluids comes back to surface in first few weeks of drilling.
Predicted sources of natural gas for the United States Hughes (2011), based on EIA/DOE annual energy outlook
“From a CO2 emissions standpoint, [shale gas] is 60 percent cleaner than coal” “60 Minutes” on CBS Television on November 14, 2010 made essentially same statement Many others….
First comprehensive analysis of greenhouse gas emissions from shale gas (including non-peer-reviewed). Published April 12, 2011.
Direct carbon dioxide emissions during combustion of fossil fuels plus indirect carbon dioxide emissions Howarth et al. (2011)
Methane emissions – the Achilles’ heel of shale gas • Natural gas is mostly methane. • Methane is 2nd most important gas behind human-increased global warming. • Methane is much more potent greenhouse gas than carbon dioxide, so even small leaks matter.
Methane is vented and leaked: • during initial flow-back period • routinely and continuously at the well site • during liquid unloading • during gas processing • during transmission, storage, and distribution
We used the best available data to estimate methane venting and leaks: • Peer-reviewed publications, when available. • EPA report from November 30, 2010. • GAO (2010) report. • American Petroleum Institute (2009) report. • archived PowerPoint presentations from EPA & industry, financial disclosure reports, etc.
Table 1. Methane emissions from flow-back fluids and initial production rates for 5 unconventional wells. ______________________________________________________________________________ Basin Methane Methane Initial gas Life-time Flow-back emission during emission per production production emissions flow-back day during upon well of well as % of (103 m3) flow-back completion (106 m3) life-time (103 m3 d-1) (103 m3 d-1) production ______________________________________________________________________________ Haynesville (LA) 6,800 680 640 210 3.2% Barnett (TX) 370 41 37 35 1.1% Piceance (CO) 710 79 57 55 1.3% Uinta (UT) 255 51 42 40 0.6% Den-Jules (CO) 140 12 11 ? ? _______________________________________________________________________________ (Howarth et al. 2011)
Table 1. Methane emissions from flow-back fluids and initial production rates for 5 unconventional wells. ______________________________________________________________________________ Basin Methane Methane Initial gas Life-time Flow-back emission during emission per production production emissions flow-back day during upon well of well as % of (103 m3) flow-back completion (106 m3) life-time (103 m3 d-1) (103 m3 d-1) production ______________________________________________________________________________ Haynesville (LA) 6,800 680 640 210 3.2% Barnett (TX) 370 41 37 35 1.1% Piceance (CO) 710 79 57 55 1.3% Uinta (UT) 255 51 42 40 0.6% Den-Jules (CO) 140 12 11 ? ? _______________________________________________________________________________ (Howarth et al. 2011)
Table 1. Methane emissions from flow-back fluids and initial production rates for 5 unconventional wells. ______________________________________________________________________________ Basin Methane Methane Initial gas Life-time Flow-back emission during emission per production production emissions flow-back day during upon well of well as % of (103 m3) flow-back completion (106 m3) life-time (103 m3 d-1) (103 m3 d-1) production ______________________________________________________________________________ Haynesville (LA) 6,800 680 640 210 3.2% Barnett (TX) 370 41 37 35 1.1% Piceance (CO) 710 79 57 55 1.3% Uinta (UT) 255 51 42 40 0.6% Den-Jules (CO) 140 12 11 ? ? _______________________________________________________________________________ Limited data, poor documentation (Powerpoint slides from EPA workshops). We have chosen to use the mean emission percentage of 1.6% (Howarth et al. 2011)
Sources of methane leaks (as percentage of life-time total production): Conventional Gas Shale Gas Initial drilling & completion 0.01% 1.9% 1.6% from flow-back fluids, plus 0.3% from drill-out following hydraulic fracturing (0.6% equally likely, but we are being conservative). Source: EPA (2010) plus numerous industry reports and presentation.
Sources of methane leaks (as percentage of life-time total production): Conventional Gas Shale Gas Initial drilling & completion 0.01% 1.9% Routine leaks & emissions at well site 0.3 to 1.9% 0.3 to 1.9% 0.3% reflects use of best technology Note that routine leaks and emissions occur continuously over 7-10 year life-time of the well, contrasting with the initial drilling and completion leaks that occur in just a few weeks. Source for routine leaks and emissions at well = GAO (2010)
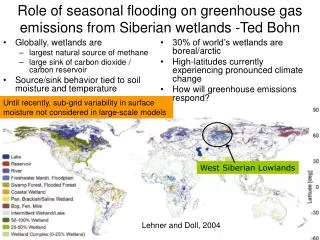
Osborn et al. (2011) – widespread methane contamination in drinking water wells near gaswells in Marcellus shale
GOOD MECHANICAL INTEGRITY CONDUCTOR PIPE FRESH WATER AQUIFER ZONE SURFACE CASING PRODUCTION CASING SHALLOW PRODUCING ZONE INTERMEDIATE PRODUCING ZONE TARGET PRODUCING ZONE
LEAK THROUGH CASING CONDUCTOR PIPE PRESSURE BUILDS UP FRESH WATER AQUIFER ZONE SURFACE CASING PRODUCTION CASING FORMATION CASING SHALLOW PRODUCING ZONE INTERMEDIATE PRODUCING ZONE TARGET PRODUCING ZONE
Sources of methane leaks (as percentage of life-time total production): Conventional Gas Shale Gas Initial drilling & completion 0.01% 1.9% Routine leaks & emissions at well site 0.3 to 1.9% 0.3 to 1.9% Venting during liquid unloading 0 to 0.26% 0 to 0.26% Emissions during gas processing 0 to 0.19% 0 to 0.19% ____________________________ TOTAL FOR PRODUCTION & PROCESSING 0.31 to 2.4% 2.2 to 4.3% 1.8- to 7-fold more methane leakage from shale gas during development and processing
Sources of methane leaks (as percentage of life-time total production): Conventional Gas Shale Gas Initial drilling & completion 0.01% 1.9% Routine leaks & emissions at well site 0.3 to 1.9% 0.3 to 1.9% Venting during liquid unloading 0 to 0.26% 0 to 0.26% Emissions during gas processing 0 to 0.19% 0 to 0.19% ____________________________ TOTAL FOR PRODUCTION & PROCESSING 0.31 to 2.4% 2.2 to 4.3% But, this is only part of the story, as the gas has to be delivered stored, transported, and distributed.
Methane (natural gas) leaks from tanks, pipelines, compressors, etc. Naked eye Infra-red (42) Methane is not visible to naked eye, but can be “seen” with infra-red cameras. 23
Half of the natural gas transmission pipelines in the US are more than half a century old Sources: PHMSA 2009 Transmission Annual Data
Two approaches for estimating leakage during transmission, storage, and distribution 1) Direct measurements, based on measurements on Russian pipeline during last 10-15 years (Lelieveld et al. 2005 ), with extrapolations from EPA (1996) study = 1.4%
Two approaches for estimating leakage during transmission, storage, and distribution 1) Direct measurements, based on measurements on Russian pipeline during last 10-15 years (Lelieveld et al. 2005 ), with extrapolations from EPA (1996) study = 1.4% 2) “missing and unaccounted for gas,” based on range of values in Texas over past decade (Percival 2010) = mean value of 3.6%
Sources of methane leaks (as percentage of life-time total production): Conventional Gas Shale Gas Initial drilling & completion 0.01% 1.9% Routine leaks & emissions at well site 0.3 to 1.9% 0.3 to 1.9% Venting during liquid unloading 0 to 0.26% 0 to 0.26% Emissions during gas processing 0 to 0.19% 0 to 0.19% Transmission, storage, and 1.4 to 3.6% 1.4 to 3.6% distribution ____________________________ Total 1.7 to 6.0% 3.6 to 7.9%
Urban infrastructure is old…. In Philadelphia, gas distribution pipes are 100 years old, made of un-welded iron pipe. Gas leakage within the city is ~ 3%. Chris Kimmerle, Executive Director, Philadelphia Gas Commission, pers. comm, April 19, 2011
How do our methane emission estimates compare with others from the peer-reviewed literature?
How do our methane emission estimates compare with others from the peer-reviewed literature? • There are no other peer-reviewed papers on methane emissions from shale gas…. • The only current and credible report, from EPA on November 30, 2010, was not peer-reviewed. Our estimates are broadly consistent with this EPA report.
How do our methane emission estimates compare with others from the peer-reviewed literature? 2) We can compare our estimates for conventional gas with 2 other peer-reviewed papers • Howarth et al. (2011) = 1.7% to 6% • Hayhoe et al. (2002), “best estimate” = 3% • (range of 0.7% to 10%) • Jamarillo et al. (2007) = 1.1% • (based entirely on EPA 1996 report; in 2010, EPA greatly increased these estimates)
Methane is far greater in its global warming potential than is carbon dioxide • 105-fold, compared over 20-year period following emission. • 33-fold, compared over 100-year period following emission.
Converting methane to global warming potential equivalents, in terms of CO2 • IPCC (1995) considered only 100-year time frame; • GWP = 21 • (used in all previous peer-reviewed studies, although Hayhoe et al. 2002 and Lelieveld et al. 2005 emphasized need for shorter horizons). • IPCC (2007); GWP for 100-year horizon = 25 • GWP for 20-year horizon = 72 • Shindell et al. (2009), Science: GWP for 100-year = 33 • GWP for 20-year = 105
Greenhouse gas footprint of shale gas and other fossil fuels (20-year analysis; methane given in CO2 equivalents, assuming Global warming Potential = 105) Grams carbon per MJ of energy (Howarth et al. 2011)
Greenhouse gas footprint of shale gas and other fossil fuels (100-year analysis; methane given in CO2 equivalents, assuming Global warming Potential = 33) Grams carbon per MJ of energy (Howarth et al. 2011)
Existing models for global warming potential (GWP) of methane only support analysis at 20-year and 100-year integrated time scales. Both are important. But shorter time focus critical to minimize likelihood of surpassing tipping points and moving climate system to some new, undesirable state.
20 year Grams carbon per MJ of energy 100 year Grams carbon per MJ of energy (Howarth et al. 2011)
Only 30% of natural gas in the U.S. is used to generate electricity…. http://www.eia.doe.gov/forecasts/aeo/excel/aeotab_2.xls
Efficiency of use of natural gas for most uses (including transportation) is very similar to that of oil or coal. For electricity, natural gas gains some efficiency over coal…. But even for electricity, GHG footprint for shale gas is similar to or worse than that for coal. Emissions from generating electricity (g C-CO2 equivalents/kWatt-hr, 20-year integration) Current average plant Best technology Coal 280 220 Shale gas 320-560 270-460 (Hughes 2011)
Very modest growth in use of both coal and natural gas predicted…. NOT replacement of coal by natural gas. Annual Energy Outlook (2011) , Energy Information Agency, U.S. Department of Energy
How does natural gas fit into the national greenhouse gas inventory?
Update by US EPA on methane emissions from gas (Nov. 30, 2010): 1996 Nov. 2010
U.S. Greenhouse gas inventory (Tg CO2 equivalents per year, 2008 base year) • Old estimate New estimate • (2010 analysis) (2011 analysis) • Total net GHG emissions 5,916 6,020 • Methane emissions 568 677 • (percent of total) (9.6%) (11%) • Methane from natural gas 97 212 • (percent of total) (1.6%) (3.5%) Based on EPA (2011), using methane global warming potential = 21 Data from: http://www.epa.gov/climatechange/emissions/usinventoryreport.html
U.S. Greenhouse gas inventory(Tg CO2 equivalents per year, 2008 base year) • Old estimate New estimate • (2010 analysis) (2011 analysis) • Total net GHG emissions 5,916 6,020 • Methane emissions 568 677 • Methane from natural gas 97 212 Equal to 3.1% leakage of all natural gas production, well within our range of 1.7% to 6% for conventional gas Based on EPA (2011), using methane global warming potential = 21 Data from: http://www.epa.gov/climatechange/emissions/usinventoryreport.html
Global warming potential Influence of Global Warming Potential (GWP) on U.S. estimation of net emissions of all greenhouse gases and methane emissions Net total emissions methane emissions Shindell et al. (2009), 100-year Shindell et al. (2009), 20-year IPCC (1996), 100-year, used by EPA (2011) IPCC (2007), 20-year IPCC (2007), 100-year Emissions data from EPA (2011)
The greenhouse gas footprint of natural gas will increase as conventional gas is further replaced by shale gas and other unconventional gas…. Using DOE (2011) projections for shale gas development and 20-year integrated GWP, the increased use of shale gas will increase the entire greenhouse gas footprint for the US by up to 9% by 2035 (with no increase in available gas or energy).
Funding from Cornell University and from the Park Foundation. Thanks to my co-authors, Renee Santoro and Tony Ingraffea.
“The acceleration of greenhouse gas (GHG) emissions from human activity is increasingly leading to harmful climate change and ocean acidification. Societies must act urgently to reduce these emissions to protect the life-sustaining biophysical systems of the Earth.” “……the necessary transitions will require nothing short of a new industrial revolution.” “……..some energy bridgesthat are currently encouraged in the transition away from GHG-emitting fossil energy systems have received inadequate scientific analysis before implementation, and thesemay have greater GHG emissions and environmental costs than often appreciated.” “…. …the development of methane from shale formations is another example where policy has preceeded adequate scientific study.”