Download
1 / 30
300 likes | 315 Vues
Explore efficiency in student transportation services with performance indicators, data analysis, and cost-saving measures. Learn to establish key metrics, benchmark data, and enhance operational excellence.

E N D
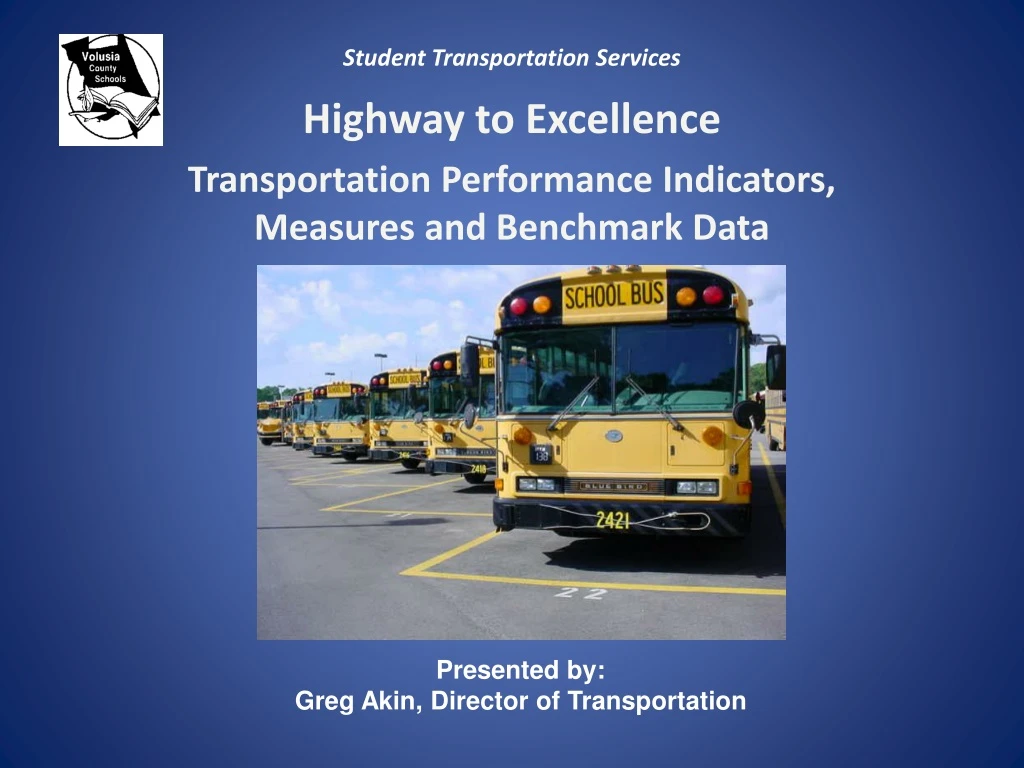
Student Transportation Services Highway to Excellence Transportation Performance Indicators, Measures and Benchmark Data Presented by: Greg Akin, Director of Transportation
Agenda • Define Efficiency. • Where do we start? • Expenditures • Revenue • Establish Performance Indicators. • Things to think about. • Cost savings measures. • Bottom line
Define Efficiency • Webster defines efficiency as: • Acting effectively with a minimum of waste or effort. • Exhibiting a high ratio of output to input.
Where do we start? • Expenditures: what is the total cost (expenditures) to run your transportation department? • Salary including benefits, fuel, tires, parts, utilities, contracted services, overhead costs, everything. • Revenue: how much money (revenue) do you generate in a school year? • State FTE funds, Warranty claims, used oil, scrap metal, field trips, fuel sales tax refund, Outside program billings, auction equipment .
Where do we start? • Establish a common set of key performance indicators in a range of acceptable parameters. • Benchmark the key performance indicators • Document effective management practices • Record the performance data to improve resource deployment and decision making over time. • Develop standards of excellence for each of the indicators
Where do we start? • Gather your data: • Total miles traveled (all buses) • Total gallons of fuel dispensed (all buses) • Total cost for fuel purchased • Total cost of oil, tires and parts • Total buses in fleet • Total route buses in fleet • Number of students transported • Organizational chart – number of bus operators, bus attendants, mechanics and office staff
Establish Performance Indicators • What do you want to measure? • Operations: • Fully allocated costs • Percentage of district budget spent on transportation • Cost per student • Percentage of students riding the school bus • Cost to operate a school bus • Cost per mile traveled • Average Bus Occupancy • Managers span of control • Established bus stops • Cost of HSH • Cost of Summer School • Cost to transport Charter Schools
Establish Performance Indicators • Fleet: • Spare Bus Ratio • Average age of buses (Years/Miles) • Average Maintenance and repair cost per vehicle • Technician – vehicle ratio • Annual parts consumption per vehicle • Average parts inventory value • Parts inventory turnover rate • Span of control • Number of breakdowns for the year • Labor Costs
Cost per Student Calculation Analysis of the Data $571.50 - $698.50 Factors That Influence This Measure • Wage and benefit structure and labor contracts • Cost of the fleet, including fleet replacement plan, facilities, insurance and maintenance • Effectiveness of the routing plan • Ability to use each bus for more than one run • Bell schedule • Maximum riding time allowed and earliest pickup time allowed • Contracted service costs • Types of transported programs served
Students Receiving Basic Home to School to Home Bus Transportation Analysis of the Data 40% – 50% Factors That Influence This Measure • % of students transported by policy and law • Placement of school attendance boundaries and zones • Viable public transportation options (Parent option) • Special programs supported by transportation
Cost per District-Operated Bus Analysis of the Data $45 k – $50 K Factors That Influence this Measure • Local cost of living factors • Bargaining unit condition • Types of programs supported; AYP, Plus-one, Academies and Cross County transportation • Geographical Location Serviced • Fuel Costs • Deadhead miles
Miles between Accidents Analysis of the Data 43 K – 74 K Factors That Influence This Measure • Definition of accident and injury as defined by Support Services Policy 505 and statute • Preventative accident training programs • Experience of driving force
Total Miles per Bus Analysis of the Data 18 K – 22 K Factors That Influence This Measure • Routing system • Types of transportation programs served • Size of service area • District-labor agreements • Location of bus terminals
Runs per Day Analysis of the Data 4 to 6 Factors That Influence This Measure • District-managed transportation • Tiered school bell times • Bell schedule changes • Bus capacities • District guidelines on maximum ride time • District geography • Minimum/shortened/staff development day scheduling • Effectiveness of the routing plan • Types and location of transported programs served
Average Bus Occupancy (Number of Students per Bus) (ABO) Analysis of the Data .90% - 1.00% Factors That Influence This Measure • Effectiveness of the routing plan • Ability to use each bus for more than one run each morning and each afternoon • Bell schedule • Type of programs served • Strategic procurement of buses leveraging seating capacity • District guidelines on maximum ride time • Parent transportation options
Students with IEP Transported on Dedicated Buses Analysis of the Data 75% - 95% Factors That Influence This Measure • District-managed transportation • Availability of alternative modes of transportation • Partnerships with public transportation agencies • District’s mainstreaming and Least Restrictive Environment policies
Transportation Expenditures as Percent of General Fund Analysis of the Data 4% - 5% Factors That Influence This Measure • Types of transported programs supported • District-run operation • Percent of students transported by policy and law • Percent transported by bus versus public transportation • Public transportation as a viable option • Labor costs in the district area • Efficient administration of program
Miles between Preventable Accidents Analysis of the Data 89 K – 106 K Factors That Influence This Measure • Definition of accident and injury as defined by the survey vs. district definition • Definition of a preventable accident • Preventative accident training programs • Experience of driving force
Cost per Total Mile Operated Analysis of the Data $4.50 - $5.50 Factors That Influence This Measure • Wage and benefit structure • Cost of the fleet, including fleet replacement plan, facilities, fuel, insurance and maintenance • Effectiveness of the routing plan • Ability to use each bus for more than one route or run • Bell schedule • Maximum riding time allowed and earliest pickup time allowed • Type of programs served will influence costs
Mutual agreements • Shared tire and recap bid • Shared battery bid • Assisted in developing consortium for fuel bid • Negotiated discount for bio-diesel fuel • Mutual aid agreement with County of Volusia for fuel Authorized warranty repair center for several manufacturer’s • Blue Bird buses • International Engines & buses • Thomas buses • Cummins engines • Carrier A/C • TransAir A/C • Ricon Wheel chair lifts • Truck-lite lighting Performing warranty repairs in-house provides reimbursement for warranty parts and labor reimbursement as high as $75.00 per hour.
Things to think about • Employee turnover rate: Recruitment /Retention • Training costs • Absenteeism rate • Vehicle accidents tracking and trend analysis • Student Behavior Management/referrals • Projected growth or decline in ridership • Collective Bargaining / Union Dialogue • Timely and accurate Billing process
Things to think about • On-time delivery • Efficiency and Effectiveness • Per school – percentage of bus riders • Breakdown per bus the number of riders • Number of buses servicing the school • Cost to run the route • Annual bus stop review • Bus utilization / pairings (3-tier system) • Deadhead miles • Employee overtime reports • Bi-annual Compliance review of records • Vandalism on buses / Break-ins at facilities or buses
Cost saving measures • Consolidated bus stops • Depot stops • Bell times • Bus route to attendant ratio • Out of zone transportation • Eliminate alternative bus stops • Remove non-eligible bus riders • Reduced idling policy • Fully utilize buses in a three tier system • No return to school procedure for unsafe behavior • Reduce overtime
Bottom Line • Expenditures versus Revenue • Would you run the department any different if it was your checkbook? • Can you do the job any better? • Continue to monitor the operations and look for ways to improve the process • Make decisions based on your data! • Balancing Act: • Quality of Service (Customer Focus) • Political Pressure
Mission Statement: through partnerships and teamwork we will provide a cooperative, responsive and personal approach to ensure safe, secure, effective and efficient transportation to support instructional programs and services for students, families and the community. The End