ODFW Marine Data Collection Efforts
220 likes | 362 Vues
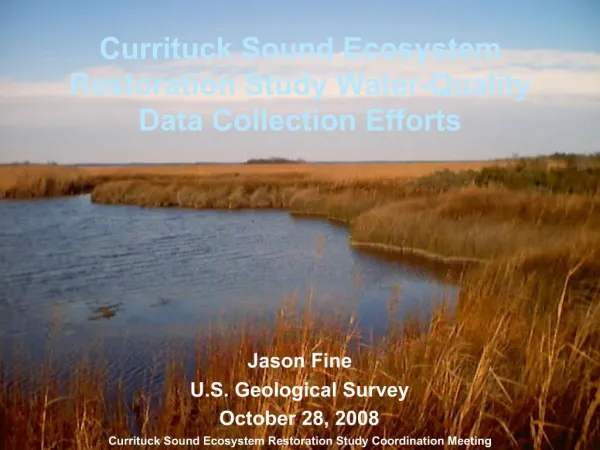
Northwest Area Committee Meeting November 2011. ODFW Marine Data Collection Efforts. David Fox Oregon Department of Fish & Wildlife Marine Resources Program. ODFW Marine Resources Program. Responsible for ocean and estuary fish, wildlife, and habitat management

ODFW Marine Data Collection Efforts
E N D
Presentation Transcript
Northwest Area Committee MeetingNovember 2011 ODFW Marine Data Collection Efforts David Fox Oregon Department of Fish & Wildlife Marine Resources Program
ODFW Marine Resources Program • Responsible for ocean and estuary fish, wildlife, and habitat management • Marine Fishery management (state and federal waters) • Research and data gathering to support fishery and other resource management • Development permit review • Marine spatial planning
Recent Work Applicable to Spill Planning and Response • Shorezone Mapping • Oregon Marine Map • Estuary Shellfish and Habitat Surveys
Shorezone Mapping Survey of ocean and estuary shoreline habitats • Low altitude aerial survey (photo and video) • Habitat classification and mapping • Standard protocols (over 100,000 km surveyed in Alaska, British Columbia, Washington, and now Oregon • Uses • Habitat management • Land use planning • Permit review • Spill response
Phase 1: Aerial survey completed June 2011 All ocean shore and estuaries - approximately 1,800 km total
Example ocean shore photos Government Point near Depoe Bay Boiler Bay North of Florence
Example estuary photos Photos from Coos Bay
Phase 2: Classify and Map Shoreline Habitats • Mapping protocol • Map products • Database products
Plans for continued work • Photography currently available at www.coastalatlas.net/shorezone/ • Complete shoreline classification and mapping (products – shoreline habitat type shapefiles, database) - Spring and Summer 2012 • Develop interactive web site (DLCD) - 2012 Example interactive Shorezone web site from Alaska
Oregon Marine Map Mapping Oregon’s Marine Resources and Uses • Marine spatial planning • State process – Territorial Sea Plan update for ocean energy development (currently underway) • Federal process – BOEM, FERC, NOAA, others (starting soon) • Requires spatial characterization of resources and human uses
Oregon Marine Map DLCD, ODFW, Ecotrust, The Nature Conservancy • Web-based GIS – Uses Google Earth interface • Consolidated existing spatial natural resource data and developed some new data – displayed as data layers in Marine Map • Biological Resources (Oregon Ecological Atlas) (ODFW) • Fishery Maps (Ecotrust, DLCD, OCZMA) • Recreational, maritime infrastructure, other human uses (DLCD)
Biological Resources • Bottom habitat • Kelp beds • Rocky intertidal shoreline Cape Blanco Cape Blanco Gold Beach Brookings
Biological Resources Cape Blanco • Seabird nesting colonies • Seabird species diversity Cape Blanco Gold Beach Brookings
Important Fishery Areas Brookings/Gold Beach – combined fishing grounds for commercial Dungeness crab, salmon (troll), rockfish (fixed gear), and urchin, and sport Dungeness crab, Pacific halibut, rockfish, and salmon. Cape Blanco Gold Beach Brookings
Other Human Uses Newport
Current Status of Oregon Marine Map • Approximately 50 data layers currently available • Will add another 50 in the next month • Developed for marine spatial planning but will be useful in all marine resource management applications • www.Oregon.marinemap.org (need Google earth plug-in)
Estuary Habitat and Shellfish Surveys Assess Oregon estuary habitat and shellfish resources • 2008: Coos Bay • 2010-2011: Tillamook Bay • 2012: Yaquina Bay, Netarts Bay • 2013 and beyond: additional estuaries
Study Goals • Quantify Bay Clam • Abundance • Biomass • Habitat characteristics • Spatial distribution • Map estuarine habitat • Develop methods that are comparable over space and time • Digitize and maintain legacy data sets
Study uses quantitative sampling methods to determine clam abundance and map estuary habitat n=90 n=91 -0.5 to 0.0m 0.0 to 0.5m 0.5 to 1.0m
Example Product – Interactive Clam Maps http://www.dfw.state.or.us/MRP/shellfish/index.asp
Example Product – Recreational shellfish harvest areas http://www.dfw.state.or.us/MRP/shellfish/index.asp
Questions • Shorezone photo products - www.coastalatlas.net/shorezone/ • Marine Map – www.Oregon.marinemap.org • Shellfish and estuary maps - www.dfw.state.or.us/MRP/shellfish/index.asp