Download
1 / 35
350 likes | 488 Vues
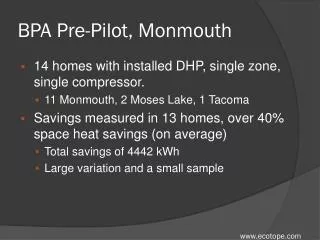
BPA Pre-Pilot, Monmouth. 14 homes with installed DHP, single zone, single compressor. 11 Monmouth, 2 Moses Lake, 1 Tacoma Savings measured in 13 homes, over 40% space heat savings (on average) Total savings of 4442 kWh Large variation and a small sample. Monmouth Analysis.

E N D
BPA Pre-Pilot, Monmouth 14 homes with installed DHP, single zone, single compressor. 11 Monmouth, 2 Moses Lake, 1 Tacoma Savings measured in 13 homes, over 40% space heat savings (on average) Total savings of 4442 kWh Large variation and a small sample
Monmouth Cooling Offset • Analysis assumed cooling if temperature was above 65° • Cooling was calculated in base load to correspond the existing cooling equipment • Very minor offsets were apparent in the very mild year (2008) • No real evidence of substantial cool increase during cooling months
Monmouth Lessons • Characteristics and full bill record is important • Occupant previous cooling behavior and supplemental heating behavior should be available • A signal to identify cooling in the DHP very important • Use of sub-metered data without a sub-metered base case is workable • Savings vary from 30-70 percent of heating load • Average Savings 45%
Ecotope RTF Presentation November 9, 2009 Progress Report on Regional Ductless Heat Pump Evaluation
Project Goals Provide a technical evaluation of DHP • Develop computational procedure • Extend and verify deemed savings tables Evaluate achieved energy savings • Using detailed metering to review the interaction with electric zonal heating and temperature control • Using Billing analysis to develop the net savings Develop cost/benefit analysis • Using cost from implementation • Savings generalized from metering and billing analysis Assess market response from customers distributors, and installers Evaluate program delivery and alternatives
Field Monitoring Approach • Quad metering, DHP, DHW, Elect. Heat, Total use • Develop in situ measurement of Heat Pump COP • Recruit participants from targeted localities • Willamette, Puget Sound: random samples • Inland Empire, Boise/Twin Falls & Eastern Idaho: Engineering samples • Target about 100 sites • Pre-Bill screening for “wood” heat • Install heat pump COP measure on 35 sites • On site audit: age, type, heat loss, infiltration • Upload data daily, one year minimum
Lab Testing & Analysis • Lab testing critical to assessing manufacturers’ ratings and to establishing air flow and COP • Testing underway at Herrick Labs, Purdue University • Initial data expected in December
Billing Analysis • Develop realized savings from comparison with pre-installation energy use • Account for weather variation • Include impact of fuel switching, other occupant take-backs • Collect utility bills from participants and non-participants • Use a PRISM-like regression analysis • Results by climate zone, house type, etc. • Separate impacts of supplemental fuels
Cost-Effectiveness Analysis • Develop cost and benefit matrix • Savings by climate, house type • Costs by DHP size, zones • Use ProCost model • TRC and utility cost/benefit analysis • Develop consumer economics analysis
Market and Process Analysis • Surveys of consumers, installers, manufacturers, and project stakeholders • Data to augment impact evaluation findings • Two Waves: Early read, one year later
Schedule Milestones • Field Monitoring • Complete Installs, Dec. 2009 • Complete data collection Spring 2011 • Billing Analysis • Begin utility coordination, Spring 2009 • Complete data collection, Fall 2011 • Lab Testing & Analysis: Fall 2010 • Process, Market Evaluation • Two waves, Spring 2009, Fall 2010 • Cost-Effectiveness Report, Spring 2012 • Final Report: Spring 2012
Data collected: July to November, 2009 Data Summaries, Heating, Cooling Ductless Heat Pump Evaluation
Current Data Summaries for Heating Operation • Early 2009 Heating data: Each Climate “Cluster” • Idaho Falls temperature similar to peak Portland temperatures. • Considerable diversity in mild temperature in DHP usage and heating fraction. • COP measurements for heating conditions show potential
Current Data Summaries for Summer Operation • Summer 2009 very hot with a substantial cooling load • Several comparisons made between cooler summer weeks and the Portland “heat storm,” July 25-31 • Two different heat pumps are shown here a large Mitsubishi and a small Fujitsu. The Mitsubishi used in the initial runs two years ago (HSPF 8.2 EER 8.8) The Fujitsu released in mid 2008 (HSPF 10.0 EER 10.4)
Contact Information: Poppy Storm Ecotope, Inc. 4056 9th Avenue NE Seattle, Washington 98105 PH: (206) 322-3753, FAX: (206) 325-7270 www.ecotope.com