Example (Transportation Problem)
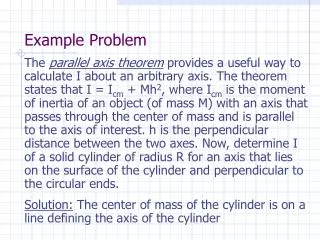
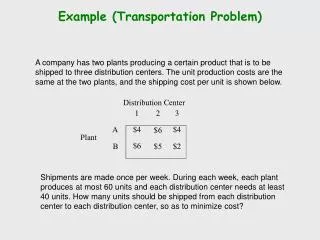
Example (Transportation Problem). A company has two plants producing a certain product that is to be shipped to three distribution centers. The unit production costs are the same at the two plants, and the shipping cost per unit is shown below. Distribution Center. Plant.

Example (Transportation Problem)
E N D
Presentation Transcript
Example (Transportation Problem) A company has two plants producing a certain product that is to be shipped to three distribution centers. The unit production costs are the same at the two plants, and the shipping cost per unit is shown below. Distribution Center Plant Shipments are made once per week. During each week, each plant produces at most 60 units and each distribution center needs at least 40 units. How many units should be shipped from each distribution center to each distribution center, so as to minimize cost?
Figure 5.1: Location of the canneries and warehouses for the P & T Co. problem.
Figure 5.2: A spreadsheet formulation of the P & T Co. problem as a transportation problem, where rows 3-9 show the parameter table and rows 12-20 display the solution table after using the Excel Solver to obtain an optimal distribution plan. Both the formulas for the output cells and the specifications needed to set up the Solver are on the next slide.
Figure 5.2: The formulas for the output cells and the specifications needed to set up the Solver.
Figure 5.3: The network representation of the P & T Co. transportation problem shows all the data in Table 5.5 graphically.
Example (Assignment Problem)(Problem 5.22 in the book) Ca rl 37 . 7 43 . 4 33 . 3 29 . 2 Ch r i s 32 . 9 33 . 1 28 . 5 26 . 4 D avid 33 . 8 42 . 2 38 . 9 29 . 6 Tony 37 34 . 7 30 . 4 28 . 5 K en 35 . 4 41 . 8 33 . 6 31 . 1 The coach of a swim team needs to assign swimmers to a 200-yard medley relay team (four swimmers, each swims 50 yards of one of the four strokes). Since most of the best swimmers are very fast in more than one stroke, it is not clear which swimmer should be assigned to each of the four strokes. The five fastest swimmers and their best times (in seconds) they have achieved in each of the strokes (for 50 yards) are Backstroke Breaststroke Butterfly Freestyle How should the swimmers be assigned to make the fastest relay team?
Figure 5.18: The formulas for the output cells and the specifications needed to set up the Solver for the Sellmore Co. problem.