
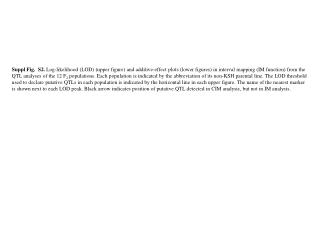
Log-Likelihood and Additive Effect Plots from QTL Analyses of 12 F2 Populations
This supplementary figure presents log-likelihood (LOD) and additive effect plots derived from interval mapping (IM) analyses conducted on 12 F2 populations. Each population is labeled with its non-KSH parental line abbreviation. The LOD threshold for identifying putative QTLs is indicated by the horizontal line in the upper figures, while the nearest marker names are displayed next to each LOD peak. Additionally, black arrows mark putative QTLs detected via CIM analysis but not through IM analysis, highlighting the complexity of QTL identification across different methodologies.

Log-Likelihood and Additive Effect Plots from QTL Analyses of 12 F2 Populations
E N D
Presentation Transcript
Suppl Fig. S2. Log-likelihood (LOD) (upper figure) and additive-effect plots (lower figures) in interval mapping (IM function) from the QTL analyses of the 12 F2 populations. Each population is indicated by the abbreviation of its non-KSH parental line. The LOD threshold used to declare putative QTLs in each population is indicated by the horizontal line in each upper figure. The name of the nearest marker is shown next to each LOD peak. Black arrow indicates position of putative QTL detected in CIM analysis, but not in IM analysis.
Hd1 RM3670 QZZ TUP RM5556 P0015 DAV RM5556 MUH P0013 P0136
TOB BAS RM6836-1 RM5556 AH06000195 RM3431A DPZ KMK RM5556 RM3867
Hd1 BKH NAB RM5556 RM3805 RM6863 RM3346 KNJ BLE RM6970 RM6970 RM1362-2 RM3805 RM3431A