Download
1 / 29
290 likes | 314 Vues
Investigate CO2 concentrations in Hawaii and the South Pole, analyzing different cycles, pools, and fluxes affecting atmosphere. Understand how energy and matter transformations influence carbon dynamics.

E N D
Human Energy Systems UnitActivity 4.5 How Seasons and Oceans Affect Atmospheric CO2 Carbon: Transformations in Matter and Energy Environmental Literacy ProjectMichigan State University
Goals for Activity 4.5 We want to figure out • Why CO2 concentrations in Hawaii are different from CO2 concentrations at the South Pole, • How other pools and fluxes affect atmospheric CO2
Questions about NOAA Video Watch the video: https://www.esrl.noaa.gov/gmd/ccgg/trends/history.html Questions: • Why do you think that this video is nicknamed the “Pumphandle Video?” • What does this show about the annual cycle of CO2 concentrations in the Northern and the Southern Hemispheres?
Annual Cycle: Hawaii vs. South Pole Hawaii Peaks: May • Why do CO2 concentrations vary more in Hawaii than at the South Pole? • Why do they rise and fall at different times of the year? South Pole Peaks: October (Video: https://www.youtube.com/watch?v=UatUDnFmNTY&feature=youtu.be )
What’s the Pattern? April January July October
Putting It All Together • Several processes affect atmospheric CO2 concentrations, including photosynthesis, cellular respiration, and combustion. Which process is most responsible for the annual cycle in the Keeling Curve? (For an explanation of how changes in sunlight drive changes in photosynthesis, see https://www.youtube.com/watch?v=WgHmqv_-UbQ ) • How are the annual cycles of CO2 concentrations in Hawaii (Keeling Curve) and the South Pole different? • Can you use these ideas to explain the differences in the annual cycles? (Remember that a good explanations answers the Four Large-scale Questions.)
Four Questions Explanation Checklist Setting the stage Did you name and describe the observations or patterns in data that you are explaining? Did you explain how the system is changing (or how you predict it will change? 1. Carbon Pools: Where are the carbon pools in our environment? Did you name and describe all the pools that are involved in the process? Did you say what kinds of carbon molecules are in the pool (CO2 or organic carbon)? 2. Carbon Cycling: How are carbon atoms cycling among pools? Did you name all the fluxes that move carbon atoms from one pool to another? Did you explain the chemical changes that go with those carbon fluxes? 3. Energy Flow: How does energy flow through environmental systems? Did you identify the carbon pools with stored chemical energy? Did you explain where the chemical energy in those pools comes from? Did you explain how energy is transformed in carbon fluxes? 4. Stability and Change: How do carbon fluxes change the size of carbon pools? Did you explain whether the fluxes going into or out of each pool are balanced or unbalanced? Did you explain or predict how unbalanced fluxes will change the size of pools? Other Elements to Consider Did you use scientific vocabulary correctly? Did you organize your explanation logically to tell a story that flows?
Spoiler alert! Answer the questions on Part A of the 4.5 Seasons & Oceans Worksheet before you view the next five slides!
Carbon Cycling Question: Which flux changes most with the seasons?
Energy Flow Question: How does energy cause changes in photosynthesis?
Stability and Change Question: Why are CO2 concentrations different? Northern Hemisphere Southern Hemisphere Summer (November to March): More sunlight More photosynthesis CO2 concentrations fall Winter (May to September): Less sunlight Less photosynthesis CO2 concentrations rise • Winter (November to March): • Less sunlight • Less photosynthesis • CO2 concentrations rise • Summer (May to September): • More sunlight • More photosynthesis • CO2 concentrations fall
Goals for Activity 4.5 We want to figure out • Why CO2 concentrations in Hawaii are different from CO2 concentrations at the South Pole, • How other pools and fluxes affect atmospheric CO2
Can you use this diagram to calculate how the atmospheric carbon pool is changing?
Rules for pools and fluxes • When fluxes into and out of a pool are balanced, pool sizes don’t change. • When fluxes into and out of a pool are not balanced, pool sizes change. • How fast the pool sizes change depends on the difference between the opposing fluxes. We call the difference the net flux. • When the incoming fluxes are bigger than the outgoing fluxes, the net flux is positive and thepool grows. • When the incoming fluxes are smaller than the outgoing fluxes, the net flux is negative and the pool shrinks.
Can you use this diagram to calculate how the atmospheric carbon pool is changing? Fossil fuels: 10 GtC/yr into atmosphere Overall: 10 + 0 – 2 = 8 GtC/yr into atmosphere Vegetation and soils: 60 + 59 + 1 GtC/yr into atmosphere – 120 GtC/yr into oceans = 0 GtC/yr overall flux Oceans: 78 GtC/yr into atmosphere – 80 GtC/yr into oceans = 2 GtC/yr out of atmosphere
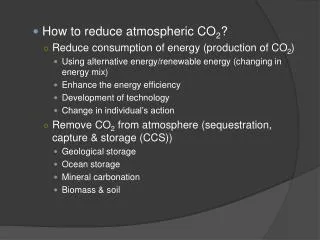
What happens when oceans absorb CO2? • Good: Less CO2 in the atmosphere, so slower climate change • Bad: Ocean acidification. See https://ocean.si.edu/ocean-life/invertebrates/ocean-acidification
Use the Global Carbon Cycle diagram to revise your predictions: What will happen to CO2 concentrations if we cut fossil fuel use in half?
Spoiler alert! Make your prediction in Part B of the 4.5 Seasons & Oceans Worksheet before you view the next slide!
Can you use this diagram to calculate how the atmospheric carbon pool is changing? Fossil fuels: 10/2 = 5 GtC/yr into atmosphere Overall: 5 + 0 – 2 = 3 GtC/yr into atmosphere Vegetation and soils: 60 + 59 + 1 GtC/yr into atmosphere – 120 GtC/yr into oceans = 0 GtC/yr overall flux Oceans: 70 GtC/yr into atmosphere – 72 GtC/yr into oceans = 2 GtC/yr out of atmosphere
Learning Tracking Tool Goals: We want to figure out (a) what makes CO2 concentrations in Hawaii go up every winter and down every summer, (b) what makes CO2 concentrations a little higher each year, and (c) how to predict future CO2 concentrations. • Activity and Data Sources • What We Learned • Questions We Still Have