Download
1 / 43
430 likes | 522 Vues
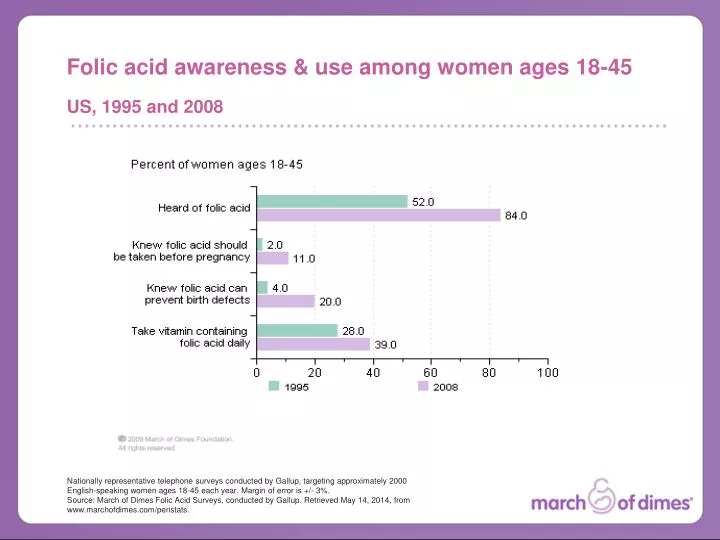
Folic acid awareness & use among women ages 18-45. US, 1995 and 2008.

E N D
Folic acid awareness & use among women ages 18-45 US, 1995 and 2008 Nationally representative telephone surveys conducted by Gallup, targeting approximately 2000 English-speaking women ages 18-45 each year. Margin of error is +/- 3%. Source: March of Dimes Folic Acid Surveys, conducted by Gallup. Retrieved May 14, 2014, from www.marchofdimes.com/peristats.
Low birthweight births US, 2002-2012 Low birthweight is less than 2500 grams (5 1/2 pounds). Very low birthweight is less than 1500 grams (3 1/3 pounds). Moderately low birthweight is 1500-2499 grams. Source: National Center for Health Statistics, final natality data. Retrieved May 14, 2014, from www.marchofdimes.com/peristats.
Low birthweight births by maternal race/ethnicity US, 2012 All race categories exclude Hispanics. Low birthweight is less than 2500 grams (5 1/2 pounds). Very low birthweight is less than 1500 grams (3 1/3 pounds). Moderately low birthweight is 1500-2499 grams. Source: National Center for Health Statistics, final natality data. Retrieved May 14, 2014, from www.marchofdimes.com/peristats.
Low birthweight births by maternal Hispanic ethnicity US, 2012 Low birthweight is less than 2500 grams (5 1/2 pounds). Very low birthweight is less than 1500 grams (3 1/3 pounds). Moderately low birthweight is 1500-2499 grams. Source: National Center for Health Statistics, final natality data. Retrieved May 14, 2014, from www.marchofdimes.com/peristats.
Low birthweight births by maternal age US, 2012 Low birthweight is less than 2500 grams (5 1/2 pounds). Very low birthweight is less than 1500 grams (3 1/3 pounds). Moderately low birthweight is 1500-2499 grams. Source: National Center for Health Statistics, final natality data. Retrieved May 14, 2014, from www.marchofdimes.com/peristats.
Low birthweight births by plurality US, 2012 Low birthweight is less than 2500 grams (5 1/2 pounds). Very low birthweight is less than 1500 grams (3 1/3 pounds). Moderately low birthweight is 1500-2499 grams. Source: National Center for Health Statistics, final natality data. Retrieved May 14, 2014, from www.marchofdimes.com/peristats.
Live births by birthweight and gestation US, 2012 Low birthweight is less than 2500 grams (5 1/2 pounds). Very low birthweight is less than 1500 grams (3 1/3 pounds). Preterm is less than 37 completed weeks gestation. Source: National Center for Health Statistics, final natality data. Retrieved May 14, 2014, from www.marchofdimes.com/peristats.
Preterm births US, 2002-2012 Preterm is less than 37 completed weeks gestation. Very preterm is less than 32 completed weeks gestation. Moderately preterm is 32-36 completed weeks of gestation. Source: National Center for Health Statistics, final natality data. Retrieved May 14, 2014, from www.marchofdimes.com/peristats.
Late preterm births US, 2002-2012 Late preterm is between 34 and 36 weeks gestation. Source: National Center for Health Statistics, final natality data. Retrieved May 14, 2014, from www.marchofdimes.com/peristats.
Distribution of all preterm births US, 2012 Preterm is less than 37 completed weeks gestation. Very preterm is less than 32 completed weeks gestation. Late preterm is between 34 and 36 weeks gestation. Source: National Center for Health Statistics, final natality data. Retrieved May 14, 2014, from www.marchofdimes.com/peristats.
Preterm births by maternal race/ethnicity US, 2012 All race categories exclude Hispanics. Preterm is less than 37 completed weeks gestation. Very preterm is less than 32 completed weeks gestation. Moderately preterm is 32-36 completed weeks of gestation. Source: National Center for Health Statistics, final natality data. Retrieved May 14, 2014, from www.marchofdimes.com/peristats.
Late preterm births by maternal race/ethnicity US, 2012 All race categories exclude Hispanics. Late preterm is between 34 and 36 weeks gestation. Source: National Center for Health Statistics, final natality data. Retrieved May 14, 2014, from www.marchofdimes.com/peristats.
Preterm births by maternal Hispanic ethnicity US, 2012 Preterm is less than 37 completed weeks gestation. Very preterm is less than 32 completed weeks gestation. Moderately preterm is 32-36 completed weeks of gestation. Source: National Center for Health Statistics, final natality data. Retrieved May 14, 2014, from www.marchofdimes.com/peristats.
Late preterm births by maternal Hispanic ethnicity US, 2012 Late preterm is between 34 and 36 weeks gestation. Source: National Center for Health Statistics, final natality data. Retrieved May 14, 2014, from www.marchofdimes.com/peristats.
Preterm births by maternal age US, 2012 Preterm is less than 37 completed weeks gestation. Very preterm is less than 32 completed weeks gestation. Moderately preterm is 32-36 completed weeks of gestation. Source: National Center for Health Statistics, final natality data. Retrieved May 14, 2014, from www.marchofdimes.com/peristats.
Late preterm births by maternal age US, 2012 Late preterm is between 34 and 36 weeks gestation. Source: National Center for Health Statistics, final natality data. Retrieved May 14, 2014, from www.marchofdimes.com/peristats.
Preterm births by plurality US, 2012 Preterm is less than 37 completed weeks gestation. Very preterm is less than 32 completed weeks gestation. Moderately preterm is 32-36 completed weeks of gestation. Source: National Center for Health Statistics, final natality data. Retrieved May 14, 2014, from www.marchofdimes.com/peristats.
Late preterm births by plurality US, 2012 Late preterm is between 34 and 36 weeks gestation. Source: National Center for Health Statistics, final natality data. Retrieved May 14, 2014, from www.marchofdimes.com/peristats.
Preterm births among singleton deliveries US, 2012 Preterm is less than 37 completed weeks gestation. Source: National Center for Health Statistics, final natality data. Retrieved May 14, 2014, from www.marchofdimes.com/peristats.
Preterm births among multiple deliveries US, 2002-2012 Preterm is less than 37 completed weeks gestation. Multiple deliveries include twin, triplet and higher order deliveries. Source: National Center for Health Statistics, final natality data. Retrieved May 14, 2014, from www.marchofdimes.com/peristats.
Average medical costs among preterm and term births US, 2005 Preterm is less than 37 completed weeks gestation. Source: Institute of Medicine. 2007. Preterm Birth: Causes, Consequences, and Prevention. National Academy Press, Washington, D.C. Published and unpublished analyses. Retrieved May 14, 2014, from www.marchofdimes.com/peristats.
Distribution of $26 billion societal economic costs of preterm birth US, 2005 Source: Institute of Medicine. 2007. Preterm Birth: Causes, Consequences, and Prevention. National Academy Press, Washington, D.C. Published and unpublished analyses. Retrieved May 14, 2014, from www.marchofdimes.com/peristats.
Average length of stay among preterm and term births US, 2005 Source: Institute of Medicine. 2007. Preterm Birth: Causes, Consequences, and Prevention. National Academy Press, Washington, D.C. Published and unpublished analyses. Retrieved May 14, 2014, from www.marchofdimes.com/peristats.
Multiple deliveries by maternal race/ethnicity US, 2002-2012 All race categories exclude Hispanics. Multiple deliveries include twin, triplet and higher order deliveries. Source: National Center for Health Statistics, final natality data. Retrieved May 14, 2014, from www.marchofdimes.com/peristats.
Multiple deliveries by maternal age US, 2012 Multiple deliveries include twin, triplet and higher order deliveries. Source: National Center for Health Statistics, final natality data. Retrieved May 14, 2014, from www.marchofdimes.com/peristats.
Total cesarean deliveries US, 2002-2012 Source: National Center for Health Statistics, final natality data. Retrieved May 14, 2014, from www.marchofdimes.com/peristats.
Rate of live births by age of teen mother US, 2002-2012 Birth rates presented are calculated using Census 2000-based population estimates available at: www.cdc.gov/nchs/about/major/dvs/popbridge/popbridge.htm. The rates shown may differ from rates computed on the basis of other population estimates. Source: National Center for Health Statistics, final natality data. US Census Bureau. Population estimates based on bridged race categories released by the National Center for Health Statistics. Retrieved May 14, 2014, from www.marchofdimes.com/peristats.
Infant mortality rates US, 1915-2010 An infant death occurs within the first year of life. Source: National Center for Health Statistics, final mortality data, 1915-1994 and period linked birth/infant death data, 1995-present. Retrieved May 14, 2014, from www.marchofdimes.com/peristats.
Infant mortality rates by maternal race/ethnicity US, 2001-2010 All race categories exclude Hispanics. An infant death occurs within the first year of life. Source: National Center for Health Statistics, period linked birth/infant death data. Retrieved May 14, 2014, from www.marchofdimes.com/peristats.
Infant mortality rates by maternal race/ethnicity US, 2010 All race categories exclude Hispanics. An infant death occurs within the first year of life. Source: National Center for Health Statistics, period linked birth/infant death data. Retrieved May 14, 2014, from www.marchofdimes.com/peristats.
Infant mortality rates by maternal Hispanic ethnicity US, 2010 An infant death occurs within the first year of life. Source: National Center for Health Statistics, period linked birth/infant death data. Retrieved May 14, 2014, from www.marchofdimes.com/peristats.
Infant mortality rates by maternal age US, 2010 An infant death occurs within the first year of life. Source: National Center for Health Statistics, period linked birth/infant death data. Retrieved May 14, 2014, from www.marchofdimes.com/peristats.
Neonatal and postneonatal mortality rates US, 1960-2010 A neonatal death occurs from birth through 27 days of life. A postneonatal death occurs from 28 days to under one year of life. Source: National Center for Health Statistics, period linked birth/infant death data. Retrieved May 14, 2014, from www.marchofdimes.com/peristats.
Ten leading causes of infant mortality US, 2010 An infant death occurs within the first year of life. SIDS is Sudden Infant Death Syndrome. RDS is Respiratory Distress Syndrome. Source: National Center for Health Statistics, period linked birth/infant death data. Retrieved May 14, 2014, from www.marchofdimes.com/peristats.
Leading cause-specific infant mortality rates by maternal race/ethnicity US, 2010 All race categories exclude Hispanics. An infant death occurs within the first year of life. SIDS is Sudden Infant Death Syndrome. RDS is Respiratory Distress Syndrome. "Maternal Preg. Comp." stands for "Maternal Complications of Pregnancy." "Prem./LBW" stands for "Prematurity/Low Birthweight." "Placenta/Cord Comp." stands for "Complications of the Placenta, Cord, and Membranes." Source: National Center for Health Statistics, period linked birth/infant death data. Retrieved May 14, 2014, from www.marchofdimes.com/peristats.
Leading causes of infant deaths US, 2010 An infant death occurs within the first year of life. SIDS is Sudden Infant Death Syndrome. RDS is Respiratory Distress Syndrome. Source: National Center for Health Statistics, period linked birth/infant death data. Retrieved May 14, 2014, from www.marchofdimes.com/peristats.
Leading causes of infant deaths: birth defects US, 2010 Source: National Center for Health Statistics, period linked birth/infant death data. Retrieved May 14, 2014, from www.marchofdimes.com/peristats.
Maternal mortality by race US, 1970-2007 Rates from 1970-1988 are based on race of child. Rates after 1988 are based on race of mother. Source: National Center for Health Statistics, final mortality data. Retrieved May 14, 2014, from www.marchofdimes.com/peristats.
Smoking among women ages 18-44 US, 2002-2012 Smoking is defined as having ever smoked 100 cigarettes in a lifetime and currently smoking everyday or some days. Percent reported is among women ages 18-44. Hawaii did not conduct BRFSS surveillance in 2004 and is not included in the U.S. rate for this year. Source: National Center for Health Statistics, final mortality data. Retrieved May 14, 2014, from www.marchofdimes.com/peristats.
Binge alcohol use among women ages 18-44 US, 2002-2012 Beginning in 2006, binge alcohol use is defined as having four or more drinks on at least one occasion during the past month. Prior to 2006, binge alcohol use is defined as having five or more drinks on at least one occasion during the past month. Percent reported is among women ages 18-44. Hawaii did not conduct BRFSS surveillance in 2004 and is not included in the U.S. rate for this year. Source: Behavioral Risk Factor Surveillance System, Centers for Disease Control and Prevention. Retrieved May 14, 2014, from www.marchofdimes.com/peristats.
Obesity among women ages 18-44 US, 2002-2012 Obesity is defined as a Body Mass Index of 30 or more. Hawaii did not conduct BRFSS surveillance in 2004 and is not included in the U.S. rate for this year. Source: Behavioral Risk Factor Surveillance System, Centers for Disease Control and Prevention. Retrieved May 14, 2014, from www.marchofdimes.com/peristats.
Health insurance coverage among women ages 15-44 US, 2012 Medicaid includes State Children's Health Insurance Program. Source: US Census Bureau. Data prepared for the March of Dimes using the Current Population Survey Annual Social and Economic Supplements. Retrieved May 14, 2014, from www.marchofdimes.com/peristats.
Health insurance coverage among children age <19 US, 2012 Medicaid includes State Children's Health Insurance Program. Source: US Census Bureau. Data prepared for the March of Dimes using the Current Population Survey Annual Social and Economic Supplements. Retrieved May 14, 2014, from www.marchofdimes.com/peristats.