Download
1 / 96
1.01k likes | 1.36k Vues
Field Test Analysis Report: SAS Macro and Item/Distractor/DIF Analyses. Prepared by Yi- Hsin Chen, Chunhua Cao, and Stephanie Green College of Education at USF Presented at the meeting of the Central Florida Assessment Collaborative (CFAC) May 20 th , 2014, Orlando Florida.

E N D
Field Test Analysis Report:SAS Macro and Item/Distractor/DIF Analyses Prepared by Yi-Hsin Chen, Chunhua Cao, and Stephanie Green College of Education at USF Presented at the meeting of the Central Florida Assessment Collaborative (CFAC) May 20th, 2014, Orlando Florida
Agenda of This Presentation • SAS macro for CTT test/item analysis, IRT 2PL model, and Mantel-Haenszel differential item functioning (DIF) analysis • Introduction of statistical concepts for test/item development • Item Analyses: CTT and IRT • Distractor Analysis • DIF Analysis
SAS Macro Outputs • A SAS macro developed for this project • There are six excel outputs • Test score statistics • Frequencies of options for each item • Item analysis statistics • Distractor analysis • DIF • 2PL item parameter • Available upon request at ychen5@usf.edu
Sample size • N: Sample size 85, 60, 70, 44, 59, 89, 99, 79, . , 100 N=10 • USED_N: Sample size used for analysis without missing data • one missing data • USED_N = 9
Central Tendency • MEAN: Arithmetic average • Most frequently reported measure of central tendency • Sum of scores divided by number of scores
Test Statistics: Central Tendency • MEDIAN (Q2): the score at the 50th percentile • half of the examinees score above median, and half score below median 110 105 100 95 90 110 105 100 95 95 90 Median = 100 Median = 95+100 / 2 = 97.5
Percentiles • Percentile is considered when we consider the percentage of scores that fall below a given point • They are very useful for interpreting an individual student’s performance • Q1: The score is at the 25th percentile • Q1 = 10, indicating 25 percent of the students’ scores below 10 points • Q3: The score is at the 75th percentile
Variability • Range • Subtract lowest score (Minimum) from highest score (Maximum) • This is a rough measure of variability High score = 90 Low score = 50 Range = ? (40) High score = 100 Low score = 50 Range = ? (50) High score = 90 Low score = 30 Range = ? (60)
Variability • Standard Deviation (SD): • an average points that deviates from the mean score • A measure of the amount of variability in examinees’ total scores • Large SD = large variability (heterogeneity) • Small SD = small variability (homogeneity) (scores cluster closer to the mean)
Variability Deviation Scores Squared 100-92= 8 82 = 64 96-92 = 4 42 = 16 94-92 = 2 22 = 4 92-92 = 0 02 = 0 90-92 = -2 (-2)2 = 4 80-92 = -12 (-12)2 = 144 232 = (X-Mean)2 SD = (X-Mean)2 = 232 = N 6 Scores 100 96 94 92 90 80 Mean = 92 6.22
Skewness and Kurtosis • SKEWNESS: • a measure to tell the shape of the score distribution, such as positive or negative skewness or symmetry • KURTOSIS: • a measure of the "peakedness" of the score distribution
Skewness a roughly negatively skewed distribution (bar chart)
Skewness a roughly positively skewed distribution (bar chart)
Kurtosis Different kurtosis values K > 0 K = 0 K < 0
Reliability: Cronbach’s Alpha • A measure of the test reliability, indicating the internal consistency of the test • Sample dependent • Different samples may obtain different reliability with the same test • Ranges from 0 to 1 • 0.7 and above: good internal consistency
Standard Error of Measurement • SEM (Standard Error of Measurement) SEM = STD * • A higher reliable test can cause smaller SEM
Item Analysis Why care?– • Item analysis helps you identify problems with your items (or scoring) • These problems can be corrected, resulting in a better test, and better measurement
Item Analysis When is it useful?– • Item analysis is most useful when you are developing a bank, or pool, of items that you will continue to use • It can be used when evaluating standardized tests • It is also a useful tool, anytime students have complained about an item • It can be used to identify mis-keyed items
Item Difficulty (p-value) • Item difficulty(proportion correct): • the proportion of examinees tested that answered the item correctly # of students who responded correctly total # of students who responded p = Ncorrect Ntotal p =
Item Difficulty (p-value) • p can range from 0 to 1.0 • A rough level of item difficulty (p) .80 and above moderately easy to very easy (mastery) .80 - .30 moderate .30 and below moderately difficult to very difficult
Item Discrimination • Discrimination can be computed using correlation • This shows the relationship betweena single item and the total test • It is expected that students with high scores answer the item correctly rpb= (point-biserial) correlation between item score and total score
Item Discrimination Corrected point-biserial correlation: • A statistic similar to point-biserial correlations • The score of the individual item is taken out of the total score so that the contribution of the item itself is removed from the correlation • This statistic is more accurate to represent item discrimination
Item Discrimination • Two ability groups (upper and lower) approach • Median score is used to divide the students into two groups • Discrimination coefficient (D-value) = percentage correct in the upper group – percentage correct in the lower group • Ranges from -1 to 1 • An item with higher and positive D-value indicates a good discriminating item • An item with a negative D-value suggests that the lower achieving group did better on an item than the higher achieving group, indicating a poor item
Item Discrimination • A rough scale of item discrimination (D) • D can range from -1 to 1 .30 and above moderate to high discrimination 0 - .30 little to no discrimination 0 and below negative discrimination (unwanted)
Item Difficulty and Discrimination Relationship between item difficulty and discrimination • there can be little discrimination: • if nearly everyone gets the item right, or • if nearly everyone gets the item wrong • there can be maximum discrimination: • if about half the people got the item right,and about half got the item wrong
Max Discrimination 0 .5 1.0 0 .5 1.0 Item Difficulty Item Difficulty and Discrimination Relationship between item difficulty and potentialdiscrimination
Alpha If an Item Deleted • “The Alpha If Deleted” shows what would happen to the internal consistency when the item is deleted • When the test_alpha_deleted coefficient goes up, compared with the original test-alpha, it indicates that without the deleted item, the test can be more reliable (that item can be removed from the test) • When the test_alpha_deleted coefficient goes down, it means that deleting that item is not a good thing and also indicates that item is a good item
Distractor Analysis • used to determine which distractors students find attractive • consider the proportion of (total) students choosing each option • compare the number of examinees selecting each option in the High and Low groups, or Example: Proportion of total examinees selecting each option
Selecting upper and lower groups • Upper and Lower groups are needed: • to hand-compute D-values, and • for distractor analysis when comparing numbers of examinees • To select Upper and Lower groups: • arrange the tests by total score • separate out the tests for each group • top half becomes Upper group, and • bottom half becomes Lower group
Selecting upper and lower groups • Upper and Lower groups are needed: • to hand-compute D-values, and • for distractor analysis when comparing number of examinees • To select Upper and Lower groups: • Upper group: top half (50%) or top 33% • Lower group: bottom half (50%) or bottom 33%
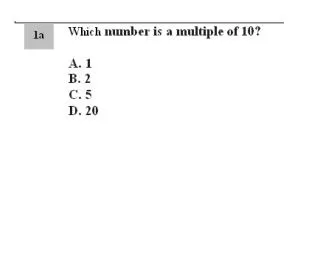
Example 1: distractor analysis 1. The capital of Switzerland is • Bern. • Zurich. • Lucerne. • Geneva. Numbers in the High and Low groups who selected each option
Example 2: distractor analysis 2. The most important part of test planning is creating: • sound instruction. • a test blueprint. • an item analysis plan. • the grading curve. Numbers in the High and Low groups who selected each option
Example 3: distractor analysis 3. Which type of essay item contains the most explicit instructions to students? • extended response • fixed response • explicit response • restricted response Numbers in the High and Low groups who selected each option
Two-Parameter Logistic Model • Alpha represents item discrimination • The value is positive • Beta represents item difficulty with the mean of 0 and the SD of 1 • Items with the negative values = easy items • Items with the positive values = hard items
Differential Item Functioning • A major concern regarding using the psychological measures is that these measures may “work differently” or be either “for or against” a particular group of examinees (e.g., gender or ethnicity) • When a test item unfairly favors one group over another, it can be said to show differential item functioning or DIF