Analyzing Reading Assessment Outcomes Among Students with Disabilities
180 likes | 304 Vues
This analysis explores the performance of 3rd and 5th grade students with disabilities, specifically those with Specific Language Impairment (SLI), Learning Disabilities (LD), and Emotional Behavioral Disorders (EBD), compared to their peers without disabilities. Utilizing data from approximately 60,000 students in a state reading assessment, the study employs multistep multinomial and binary logistic regression methodologies to identify significant differences in item responses. Findings indicate noteworthy differential item functioning (DIF) affecting students with LD, while suggesting that observed differences do not universally indicate bias against students with disabilities.

Analyzing Reading Assessment Outcomes Among Students with Disabilities
E N D
Presentation Transcript
Item Analyses by Disability Category Ross Moen, Martha Thurlow, Kentaro Kato October 11, 2007 PARA TAC Partnership for Accessible Reading Assessment (PARA): A collaboration between the University of Minnesota’sNational Center on Educational Outcomes and the Department of Curriculum & Instruction; CRESST, University of California, Davis; and Westat www.readingassessment.info
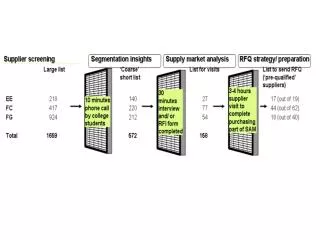
Data– Item responses from 3rd and 5th graders (approx. 60,000 for each grade) in a state reading assessment (46 multiple-choice items for each grade) Comparison– Students without disabilities vs. students with SLI, LD, or EBD Analysis– Multistep multinomial logistic regression (DIF/DDF) and multistep binary logistic regression (differential missing response functioning); Items with p > .01 and R2 difference > .003 are flagged for potential item bias; Response characteristic curves (RCCs) were plotted Methodology
Observation #1 • Statistically significant DIF/DDF was found for numerous items for all 3 groups of students with disabilities in both grades. • Large N can make even trivial differences statistically significant, so a more stringent criterion of R2> .003 was applied. • In both grades, only students with LD had items meeting the more stringent .003 criterion. For students with SLI and EBD, .003 is not even on the scale.
Figure 1. DIF/DDF R2 difference between students without disabilities and students with LD for grade 3
Figure 2. DIF/DDF R2 difference between students without disabilities and students with SLI for grade 3
Figure 3. DIF/DDF R2 difference between students without disabilities and students with EBD for grade 3
Observation #2 • Response characteristic curves suggest that not all DIF/DDF indicates bias against students with disabilities. • Examining RCCs for 4 third grade items where a distractor contributes nearly as much or more as the correct response to DIF/DDF for students with LD illustrates this.
RCCs for Item #6 A0 through D0 = students without disabilities; A1 through D1 = students with LD; the correct response is B
RCCs for Item #25 A0 through D0 = students without disabilities; A1 through D1 = students with LD; the correct response is B
RCCs for Item #42 A0 through D0 = students without disabilities; A1 through D1 = students with LD; the correct response is B
RCCs for Item #48 A0 through D0 = students without disabilities; A1 through D1 = students with LD; the correct response is C
Questions #1 • What interpretations might be made to account for these differences? • Does the test performance of students with LD look different from other students in ways besides DIF/DDF?
Final Question • Do these observations – based on these data – merit further examination?