Download
1 / 34
850 likes | 3.49k Vues
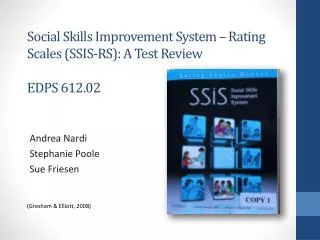
Social Skills Improvement System – Rating Scales (SSIS-RS): A Test Review EDPS 612.02. Andrea Nardi Stephanie Poole Sue Friesen. (Gresham & Elliott, 2008). Outline. Test Overview Test Organization Administration , scoring, & interpretation

E N D
Social Skills Improvement System – Rating Scales (SSIS-RS): A Test ReviewEDPS 612.02 Andrea Nardi Stephanie Poole Sue Friesen (Gresham & Elliott, 2008)
Outline • Test Overview • Test Organization • Administration, scoring, & interpretation • Psychometric Properties: Analysis & Evaluation • Standardization Sample and Norms • Reliability • Validity • Strengths and Limitations • Summary
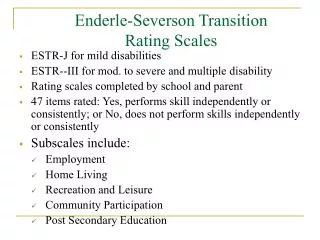
Test Overview : Use/Purpose • Multi-rater (teacher, parent, student) • Screening and assessment • Strengths • Acquisition and performance deficits • Intervention • Identify candidates for intervention services • Track progress • Pre-and post-treatment comparison • Provide longitudinal data for research
Test Organization *Students 8-12 don’t rate importance of problem behaviours
Administration Straightforward administration Four forms: Student 8-12 years Student 13-18 years Parent (3-18 years) Teacher (3-18 years) Time: 15-20 mins per form Reading ability – Gr. 2 for student forms, Gr. 5 for parent *Don’t need to use all forms, but authors strongly encourage as child’s behaviour is influenced by setting.
Administration This is from the Student 13-18 form ↑ From the Student 8-12 form
Scoring Computer scoring: • Links to relevant instructional units in SSIS Intervention Guide • Standard, Multirater, and Progress Reports • Includes response pattern index and response consistency index Scores are Standard Scores (mean 100, SD=15) or Percentile Ranks Hand scoring: • Instructions in manual • Must deal with: • adjustment values for missing items • F index for negative style • Make summary table of raw scores choose norm group confidence interval select appropriate behaviour level for each scale.
Interpretation • Requires extra training • Can obtain three kinds of reports to interpret (Standard, Multirater, or Progress) • Begin with score interpretation for each scale and subscale. • Look for overall pattern of strengths and weaknesses • Uses Model of Social Behavioural Strengths and Weaknesses
Interpretation: Model of Social Behavioral Strengths and Weaknesses --------------------------------
SSRS to SSIS • Revision of SSRS (feedback from 2 focus groups) • Update norms and improve measures ages 3-5 • Added four new subscales: • Social Skills (2 new subscales) • Problem Behavior (2 new subscales) • Improve alignment of content across all raters’ forms • Improve psychometric properties • Add validity scales • Add Spanish version • Connect assessment results to interventions
Psychometric Properties - Standardization September 2006- October 2007 • Data collected from nationwide sample totaling 4700 children, aged 3-18 • assessed at 115 sites across 36 states • Two versions of the teacher form were standardized (preschool and elementary/secondary ) • One parent form • Two student forms (elementary and secondary) (Spanish forms (parent and student) were also used in standardization)
Psychometric Properties – Norm Sample • Based on the Current Population Survey (March 2006, U.S. Census Bureau) • Applied to the 3 norm groups • preschool (age 3-5) • two school-age groups (age 5-12, and 13-18) • Each age group sample was designed to • Have equal numbers of male and female • Match the U.S. population with regard to geographic region, socioeconomic status, and race/ethnicity • Inclusion of special populations
Analysis – Standardization Sample and Demographics Good sample size (4700 students) Large number of sites (115 sites in 36 States) Three norm groups set up by ages according to 2006 Census data Stratification of sample on various factors Not enough rationale for why some states left out and how it could affect the outcome. 5-year olds were used in both preschool and elementary forms Not enough information about special education program placement
Analysis – Execution of Norming Procedures Site coordinators had a good level of training and qualifications. Attempt to control teacher rating skewness Recruitment of participants limits generalization of norms to those unlikely to have been recruited. Compensation issues Issue of unreturned forms Parents who filled out forms overwhelmingly mothers Missing data and unusual scores – did they keep or not? Confusing to sort out numbers of children who were rated by all three forms, two forms, or just one form.
Analysis – Norm Group and Score Construction Overall good description of standard score construction from mean raw scores for each subscale. Especially good description of why they couldn’t normalize the distribution of Problem Behaviours and Social Skills. Percentile ranks created to allow for correct placement of scores even considering sampling fluctuations. Overall were able to separate norms for boys and girls, and had good representation in age bands except: Preschool – parents slightly over-represented Developmental Delay and Speech/Language Impairment 13-18 yr. band – ADHD slightly over-represented by teachers Specific Learning Disabilities underrepresented
Analysis – Size of Special Populations Groups (Crosby, 2011; Lee-Farmer & Meikamp, 2010)
Internal Consistency Reliability • Median Scale Reliabilities (high) • Social skills: mid- to upper .90s for all age groups (3-5, 5-12, 13-18) • Problem Behaviours: mid- to upper .90s for all age groups • Academic competence: upper .90s for (5-12, 13-18) • Median Subscale Reliabilities (satisfactory) • Teacher form: high .80s • Parent form: mid .80s • Student form: near .80
Internal Consistency Reliability • Median Scale Reliabilities are considered high and indicate that the scale scores are relatively free from the influence of random error • Median Subscale Reliabilities are satisfactory, sufficient for analyzing strengths as weaknesses and aiding development of intervention plans • Behaviourscomprising each subscale generally reflects a common dominant trait • Are lower reliability coefficients (e.g., student subscales) adequate for purposes other than intervention planning
Test-Retest Reliability • Confirmed with average scores remaining stable following second administrations of the instrument with teachers, parents, and student completers • Each sample was representative • Includes adjusted correlation coefficient • Mean interval (teacher-43 days, parent-62 days, student 66 days) • Student Form: subscale reliability coefficients range from .59 to .81. May suggest that students interpret the behavioural statements less consistently across occasions
Inter-Rater Reliability • Most subscale coefficients for both forms were in the upper .50s to .60s (moderate-good reliability) • Each sample included students from each of the demographic categories of sex, race/ethnicity, parent’s education, region of country • Low frequency behaviours might not be well represented and skew distribution and result in smaller correlations • Relationships between raters and students varied widely • Generally, several weeks elapsed between ratings (mean interval; teacher-63 days, parent-58 days). How might this have impacted ratings? What was the reason for it?
Content Validity • Established using a developmental team • Content guidelines and key terms/items used to develop items for the Social Skills scale • DSM-IV-TR and individual expertise used to develop Problem Behaviors subscales • Used only items with a moderate to strong relationship with respective subscales
Analysis—Content Validity • Scales based on a broad survey of empirical literature • Previous research in the area of social behaviour and its relationship to student achievement support the division of classroom behaviours into: social skills, problem behaviours and academic competence • Little information about who made up the development team and their qualifications • The Behaviour Problem scale describes only a narrow range of problem behaviours
Construct Validity: Internal Structure • SSIS-RS designed to assess social behaviours that affect student-teacher and parent-child relationships, peer acceptance and academic performance • Social Skills subscale correlations—positive and moderate to high • Problem Behavior subscale correlations—positive and high • Correlations between Social Skills and Problem Behaviors scales were moderate and negative (-.42 and -.65) • Teacher Forms: Academic Competence was correlated positively and moderately with the Social Skills scales (.50 to .53) and moderately, negatively between Academic Competence and Problem Behaviors scale scores (-.41 to -.44)
Analysis—Construct Validity • Pattern of inter-correlations among scales and subscales consistent with test authors’ predictions • Individual with a high score on the Problem Behaviours scale should obtain a low score on Social Skills scale • Social Skills scale and Academic Competence scale should have a positive and moderate correlation • Academic Competence scale and Problem Behaviours scale should correlate moderately and negatively • Scale items reflect an “adult perspective” • Less representative of peer interactions
Validity Studies • The SSIS-RS was also compared to several other measures: • Behavior Assessment System for Children—2nd Ed. • Teacher Form: Social Scales highly correlated (.76-.78) Problem Behaviour scale and BASC-2 Behavioral Symptoms Index highly correlated (.71-.95) • Parent Form: Correlations are moderate to high on the Social Skills scale (.57-.80) and high for Problem Behaviours (.80’s) Student Form: None of the scales corresponded closely • Vineland Adaptive Behavior Scales, Second Edition • Teacher Form: Social Skills correlated moderately with the Socialization domain (.64) and the Daily Living Skills (.68) Vineland Communication Domain correlated moderately with the Academic Competence scale (.75) • Parent Form: Social Skills scale showed a low to moderate correlation with the Socialization Domains (.48)
Analysis—Validity Studies • In general, correlations were as expected across the forms with scales measuring similar behaviours correlating more highly than scales measuring dissimilar behaviours • The student forms on the BASC-2 show very little correlation despite the BASC-2 including 4 scales of prosocialbehaviour • This trend is particularly noticeable in the younger age groups
Strengths and Limitations Strengths Limitations “Special Population” studies have small sample sizes Relatively small sample for the Spanish version of the SSIS-RS “Adult perspective” reflected in scale items Problem Behaviour scale limited to behavioral concerns related to social interactions • Administration and scoring-- straightforward and quick • Low readability level • Parallel Teacher, Parent and Student forms • Option for re-administering the scales every 4 weeks • Scales within a multi-tiered model
Conclusion • The SSIS-RS is a quick and straightforward rating scale that is used to gather information about a child’s social skills and problem behavior. The design renders it easy to administer and score. However, caution must be used when interpreting the “Special Population” studies due to small sample size. The SSIS-RS is particularly appealing because of the use of a multi-tiered system that links to specific interventions for the child.
References Crosby, J. W. (2011). Test Review: F. M. Gresham & S. N. Elliott Social Skills Improvement System Rating Scales. Minneapolis, MN: NCS Pearson, 2008. Journal of Psychoeducational Assessment, 29(3), 292-296. doi:10.1177/0734282910385806 Doll, B., & Jones, K. (2010). [Review of the Social Skills Improvement Rating Scales.] In The eighteenth mental measurements yearbook. Retrieved from http://web.ebscohost.com.ezproxy.lib.ucalgary.ca/ Gresham, F. M. & Elliott, S. N. (2008). Social skills improvement system: Rating scales manual. Minneapolis, MN: NCS Pearson, Inc. Lee-Farmer, J., & Meikamp, J. (2010). [Social Skills Improvement Rating Scales]. In The eighteenth mental measurements yearbook. Retrieved from http://web.ebscohost.com.ezproxy.lib.ucalgary.ca/