5000
Chr1/+Fe. Reads (log2). Chr1/-Fe. Reads (log2). Chr2/+Fe. Chr3/+Fe. Chr2/-Fe. Reads (log2). Chr3/-Fe. Reads (log2). Chr4/+Fe. Chr5/+Fe. Reads (log2). 18. 18. 18. 18. 18. 18. 18. 18. 18. 18.

5000
E N D
Presentation Transcript
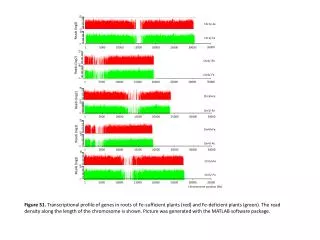
Chr1/+Fe Reads (log2) Chr1/-Fe Reads (log2) Chr2/+Fe Chr3/+Fe Chr2/-Fe Reads (log2) Chr3/-Fe Reads (log2) Chr4/+Fe Chr5/+Fe Reads (log2) 18 18 18 18 18 18 18 18 18 18 Figure S1. Transcriptional profile of genes in roots of Fe-sufficient plants (red) and Fe-deficient plants (green). The read density along the length of the chromosome is shown. Picture was generated with the MATLAB software package. Chr4/-Fe Chr5/-Fe 0 0 0 0 0 0 0 0 0 0 35000 35000 35000 35000 35000 5000 10000 15000 20000 25000 30000 1 1 5000 10000 15000 20000 25000 30000 1 5000 10000 15000 20000 25000 30000 1 1 5000 5000 10000 10000 15000 15000 20000 20000 25000 25000 30000 30000 Chromosome position (kb)