Spectrometer
The Red Tide USB 650 spectrometer from Ocean Optics analyzes the spectral distribution of light sources. By using a fiber-optic cord, it collects light data which is then processed through a computer via USB. The device utilizes a system of mirrors and a grating mirror to diffract light, allowing for measurement across 200-1100 nm. This spectrometer distinguishes between blackbody and non-blackbody emissions, displaying smooth curves or sharp peaks on its graph to represent light intensity at various wavelengths. Learn how calibration and noise reduction enhance accuracy in readings.


Spectrometer
E N D
Presentation Transcript
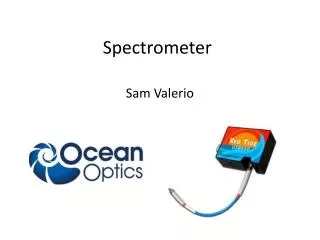
Spectrometer Sam Valerio
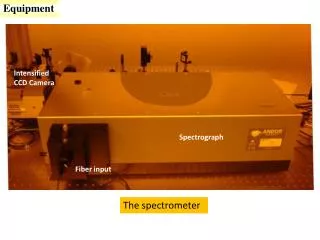
Shows spectral distribution of a light source in the form of a graph. • This specific one in the Imaging Science Center is called the Red Tide USB 650 by a company called Ocean Optics.
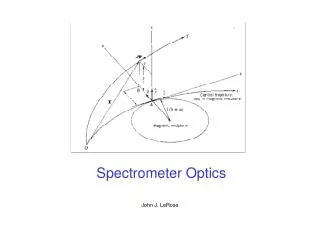
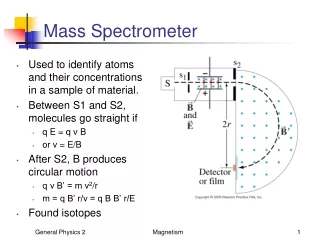
How does it work? • Point sensor at light source • Fiber-optic cord collects light data • Light comes into device (position 1 on diagram) and bounces off two separate angled mirrors (4 and 5) • Hits a grating mirror (6). Diffracts light. • Collected in 650, 25um slits (7-9) • 650 data points collected through USB cord into computer software (SpectraSuite) and plots the points on a graph that shows Intensity vs. Wavelength. Intensity basically shows the “amount” (in simple terms) of each specific wavelength. • Silicon chip in device allows it to read beyond the visible range. This one reads 200-1100nm • May need to be calibrated. When you point it at the sky without calibration, it should show a peak in the blue range, but it shows green on the plot.
Grating • Mirror with many tiny lines in it. Certain amount of engraved lines per mm. Depends on the type of grating and the specific one. • Light diffracts (bends around the lines) and separates by wavelength. • Gratings can be transmissive or reflective.Transmissive means light goes through grating and separates out the other side. Reflective means light hits grated mirror and separates backwards. This one is reflective.
Blackbody vs. Non-Blackbody • Graph may have a smooth curve with a smooth peak, or have various large sharp peaks. • Blackbody means a smooth curve. • Ideal object that is a perfect absorber of light and also a perfect emitter of light. • A perfect black body will absorb all radiation that falls on it, and will emit radiation that has a continuous spectrum determined only by the temperature of the black body. • Higher temp results in thinner curve, shorter peak wavelength, higher light intensity. • Example is a tungsten light bulb: heated piece of tungsten that emits radiation. • Sun is a blackbody, but with small dropoffs where photons it emits hit particles in the Earth’s atmosphere and deflect.
Blackbody vs. Non-Blackbody (Continued) • Non-Blackbody means various large, sharp peaks. • Emits radiation at specific wavelengths. • Peaks on graph show specific wavelength of light released at the different specific energy levels. • Example is a fluorescent light. • Electricity enters at both ends of an enclosed tube with gas (in this case mercury). • Excites electrons to different energy levels of the atom, then brings them back down to the ground state, releasing the energy in the form of a photon with a wavelength and amplitude(energy). • Amount of levels it is excited and dropped from determines wavelength given off. • If mercury electron is excited to the first energy level, per say, when it comes down to the ground state, it is not releasing very much energy, so low amplitude, longer wavelength. Vice versa for higher energy levels. • Peaks on graph show specific wavelength of light released at the different specific energy levels. • Computer screen is non-blackbody : composed of red, green, and blue wavelengths.
Fluctuations? Noise! • Fluctuations seen on the graph are a result of a phenomenon called Noise. • Interference from other sources that causes accuracy of spectrometer to drop. • Every device gives off noise, whether it be mechanical, electrical, etc. It will always be there.
Get Rid of Noise? • Few possible ways: • If the noise is truly Random Noise (which is noise values at one point) take a point on the plot at one specific wavelength, take a certain amount of the noise fluctuation values(enter number in “Scans to Average” box) , find the average, and that will give a much more accurate reading. Can be done automatically by the software by increasing the amount of noise values taken into the average. More values = more accurate reading, smoother line. • Boxcar method. Choose number, for example, 5. Enter in “Boxcar Width” box.That number means at every point, the plot will take the noise fluctuation value average, depending on the amount of values you choose, for every unit up to 5 units to the left and 5 units to the right, and makes a smoother graph. If you go too high of a number, the peaks start to become too smooth, and you lose the accuracy of the reading, so you have to find a boxcar width number proportional to the noise value number.
Why can we use this? • Applies to us because we are illuminating objects from various wavelengths of light. We need to be able to characterize the spectral distribution of the light being applied to the object, and then characterize the information received by the camera and software when the light hits the object.