FTIR Spectrometer
FTIR Spectrometer. F ourier T ransform I nfra R ed Measures IR spectrum using interference of light beam with itself Depending on configuration, may measure properties of material sample (absorption, transmission, reflectance) or spectral characteristics of external source (atmosphere).

FTIR Spectrometer
E N D
Presentation Transcript
FTIR Spectrometer • Fourier Transform InfraRed • Measures IR spectrum using interference of light beam with itself • Depending on configuration, may measure properties of material sample (absorption, transmission, reflectance) or spectral characteristics of external source (atmosphere)
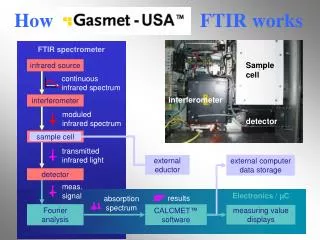
Simplified Schematic • Incoming light split by beamsplitter and sent to two mirrors • Movable mirror(s) create a path difference or retardation between two beams • Upon recombination, each wavelength experiences constructive or destructive interference
Monochromatic Light Interferogram:
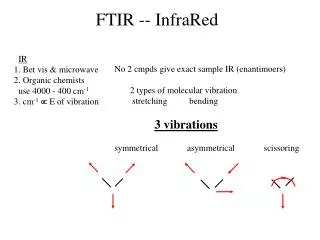
Finite Spectral Resolution • One cycle of beat frequency • Best resolution
Apodization • Problem: Spectrum is corrupted by convolution • Solution: Instead of rect function, use triangular or other window (apodization)
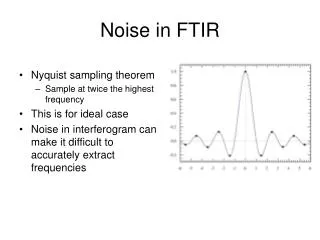
Tradeoffs • Max retardation - Spectral resolution • Interferogram sampling - Spectral range • Noise - Scan averaging (SNR N1/2) • Narrow peak - sidelobes
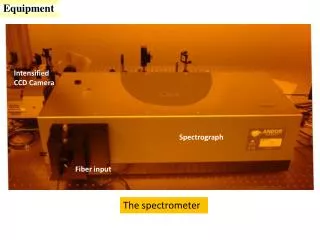
CSU FTIR Spectrometer • Max spectral resolution: 1 cm-1 • Current spectral range: 500-2000 cm-1 • Calibration targets: ambient and LN2 blackbodies