Download
1 / 39
460 likes | 864 Vues
Fourier Transform Infrared (FTIR) Spectrometer. Subhashree Mishra ATMS Grad Student, UNR W. P. Arnott Physics, UNR. Introduction to Atmospheric Instrumentation (ATMS 360) University of Nevada Reno. Energy Levels: Basic Ideas. Basic Global Warming: The C02 dance ….

E N D
Fourier Transform Infrared (FTIR) Spectrometer Subhashree Mishra ATMS Grad Student, UNR W. P. Arnott Physics, UNR Introduction to Atmospheric Instrumentation (ATMS 360) University of Nevada Reno
Energy Levels: Basic Ideas Basic Global Warming: The C02 dance … About 15 micron radiation
Wavelength and Wavenumber • Wavelength = 1 / Wavenumber • For the IR, wavelength is in microns. • Wavenumber is typically in 1/cm, or cm-1. • 5 microns corresponds to 2000 cm-1. • 20 microns corresponds to 500 cm-1. • 15 microns corresponds to 667 cm-1. Much ‘terrestrial’ IR energy at the wavenumber.
Example Problem: Instantly Double CO2 Concentration.What is the effect on the infrared spectrum at the surface? Consequence: The Earth’s surface warms because of the additional IR comingto the surface from the Atmosphere.
Example Problem: Instantly Double CO2 Concentration.What is the effect on the infrared spectrum from space? Consequence: The less IR radiation escapes to space when the atmosphere has 800 ppmCO2 because the atmosphere is less transparent to IR emitted by the Earth’s surface. TheEarth’s surface temperature must increase to again balance the outgoing IR with the incoming solar radiation.
LEDs As Detectors Each photon with enough energy will normally free exactly one electron, and result in a free hole as well. If this happens close enough to the electric field, or if free electron and free hole happen to wander into its range of influence, the field will send the electron to the N side and the hole to the P side. This causes further disruption of electrical neutrality, and if we provide an external current path, electrons will flow through the path to their original side (the P side) to unite with holes that the electric field sent there, doing work for us along the way. The electron flow provides the current, and the cell's electric field causes a voltage. With both current and voltage, we have power, which is the product of the two. From http://science.howstuffworks.com/solar-cell3.htm
FTIRs Often Use MCT Detectors: Mercury Cadmium Telluride HgCdTe or Mercury cadmium telluride (also Cadmium Mercury Telluride, MCT or CMT) is an alloy of CdTe and HgTe and is sometimes claimed to be the third semiconductor of technological importance after Silicon and Gallium(III) arsenide. The amount of cadmium (Cd) in the alloy (the alloy composition) can be chosen so as to tune the optical absorption of the material to the desired infrared wavelength. (from http://en.wikipedia.org/wiki/Mercury_cadmium_telluride)
Outline • Introduction • Theory • Design • Applications • Measurements • Discussions
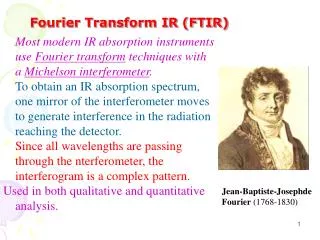
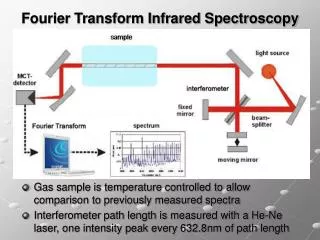
What is a FTIR Spectrometer? • A spectrometer is an optical instrument used to measure properties of light over a specific portion of the electromagnetic spectrum, 5 microns to 20 microns. • FTIR (Fourier Transform InfraRed) spectrometer is a obtains an infrared spectra by first collecting an interferogram of a sample signal using an interferometer, then performs a Fourier Transform on the interferogram to obtain the spectrum. • An interferometer is an instrument that uses the technique of superimposing (interfering) two or more waves, to detect differences between them. The FTIR spectrometer uses a Michelson interferometer.
FOURIER TRANSFORMS • Fourier transform defines a relationship between a signal in time domain and its representation in frequency domain. • Being a transform, no information is created or lost in the process, so the original signal can be recovered from the Fourier transform and vice versa. • The Fourier transform of a signal is a continuous complex valued signal capable of representing real valued or complex valued continuous time signals.
Fourier Transforms cont. • The Continuous Fourier Transform, for use on continuous signals, is defined as follows: • And the Inverse Continuous Fourier Transform, which allows you to go from the spectrum back to the signal, is defined as: F(w) is the spectrum, where w represents the frequency, and f(x) is the signal in the time where x represents the time. i is sqrt(-1), see complex number theory.
Fourier Transforms cont. • A computer can only work with finite discrete signals, not with continuous signals. Thus, we need to define the Discrete Fourier Transform (DFT). • In DFT, the infinite borders of the integrals can be replaced by finite ones, and the integral symbol can be replaced by a sum. So the DFT is defined as: And the inverse DFT is defined as:
The spectrometer described here is a modified Bomem MB-100 FTIR. • The heart of the FTIR is a Michelson interferometer (figure 2). • The mirror moves at a fixed rate. Its position is determined accurately by counting the interference fringes of a collocated Helium-Neon laser. • The Michelson interferometer splits a beam of radiation into two paths having different lengths, and then recombines them. • A detector measures the intensity variations of the exit beam as a function of path difference. • A monochromatic source would show a simple sine wave of intensity at the detector due to constructive and destructive interference as the path length changes (refer figure 3).
In the general case, a superposition of wavelengths enter spectrometer, and the detector indicates the sum of the sine waves added together. • Figure 3 shows some idealized light sources, and the interferograms that they would theoretically produce. • The difference in path length for the radiation is known as the retardation d (OM = OF + d) in figure 1 and 2. • When the retardation is zero, the detector sees a maximum because all wavenumbers of radiation add constructively. • When the retardation is l/2, the detector sees a minimum for the wavelength l. An interferogram is the sum of all of the wavenumber intensities.
Schematic of Michelson Interferometer Figure 2. Source: MS thesis submitted by Carl George Schmitt, UNR , 1998.
Sample interferograms and their theoretical source intensity Source: MS thesis submitted by Carl George Schmitt, UNR , 1998. Figure 3.
Calibration of the FTIR spectrometer Source: MS thesis submitted by Carl George Schmitt, UNR , 1998.
The spectrometer produces a complex voltage at each wavenumber. A linear model for the spectrometer response is assumed, where A is an instrument offset, and C is a scaling factor, V= A+CI (1) • If the spectrometer views a perfect blackbody, Eq. (1) gives V = A+ CBT (2) where BT is the Planck emission curve for a blackbody of temperature T. • The two unknowns (A and C) can be determined from blackbody measurements at two different temperatures, V1 = A+ CBT1 V2 = A+ CBT2
Solving for the unknowns yields C = (V1-V2)/(BT1-BT2) and A = {V1(BT1-BT2)-BT1 (V1-V2)}/(BT1-BT2) • Returning to Eq (1), The FTIR voltage of another target (Vtarget) is related to the target radiance (Itarget) by Itarget=[(BT1-BT2)Vtarget–BT1V2+BT2V1]/(V1-V2) • Thus, with measurements of blackbodies at two temperatures, the calibrated radiance from a target (cloud) can be determined.
APPLICATIONS • Identification of inorganic compounds and organic compounds • Identification of components of an unknown mixture • Analysis of solids, liquids, and gasses • In remote sensing • In measurement and analysis of Atmospheric Spectra - Solar irradiance at any point on earth - Longwave/terrestrial radiation spectra • Can also be used on satellites to probe the space
Source : UV thoughts from http://uvb.nrel.colostate.edu/UVB/publications/uvb_primer.pdf
MODIS Solar IrradianceSource : http://en.wikipedia.org/wiki/Image:MODIS_ATM_solar_irradiance.jpg
Theoretical Absorption Cross Sections for the indicated gases, averaged to 1 cm-1 resolution for clarity.
FTIR Radiance: Atmospheric IR Window 13 microns 8 microns
DEFINITION OF THE BRIGHTNESS TEMPERATURETB Measured Radiance at wavenumber v = Theoretical Radiance of a Black Body at temperature TB
Atmosphere Emission Measurements, Downwelling Radiance Notes: Wavelength range for CO2, H20, O3, CH4. Envelope blackbody curves. Monster inversion in Barrow. Water vapor makes the tropical window dirty.
Which day is more moist? RENO FTIR SPECTRA Which day is warmer near the surface?
Ideal Weighting Function Wi: Where in the atmosphere the main contribution to the radiation at wavenumber i comes from.
Downwelling Intensity Emitted by the Atmosphere to the Detector (Radiance) =cos B[T(z)] emissivity=absdz/cos z dz q blackbody radiance, T = temperature. q ftir transmission emission weighting function
Weighting Functions for Satellite Remote Sensing using the strong CO2 absorption near 15.4 um. (from Wallace and Hobbs, 2nd edition)


![Fourier transform infrared spectroscopy[FTIR]](https://cdn1.slideserve.com/2743434/fourier-transform-infrared-spectroscopy-ftir-dt.jpg)