FTIR data analysis tutorial
FTIR data analysis tutorial. Bryan Penning. *Supported by the NSF Plant Genome Research and REU Programs. Overview.

FTIR data analysis tutorial
E N D
Presentation Transcript
FTIR data analysis tutorial Bryan Penning *Supported by the NSF Plant Genome Research and REU Programs
Overview • We are establishing infrared “spectrotypes” in cell wall mutants. Spectrotypes are spectroscopic phenotypes, i.e. the spectral differences between mutant and wild type populations. • This tutorial will: • Give some background information on how we prepare and collect data on mutants (See Techniques VII at: http://cellwall.genomics.purdue.edu/techniques/7.html for more details) • Show how we analyze the data collected by Principal Components Analysis (PCA) and digital subtraction • Give some example spectral peaks that indicate differences in cell wall composition between mutants and wildtype
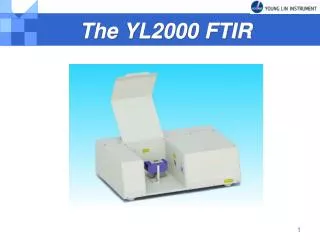
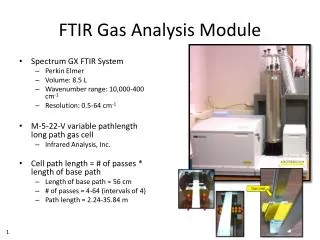
Plant preparation • All plants are grown and cell walls isolated under the same conditions and processed simultaneously for internal consistency of mutant and wild type comparisons (see Techniques VII for greater detail: http://cellwall.genomics.purdue.edu/techniques/7.html) • Wild type plants are always prepared with mutant plants • Plants are all grown on one-half strength MS salts with 1% sucrose and 0.8% agar in the light for 12 days • Plants are all transferred to the dark for 2 days to lower starch content (a contaminating feature in IR spectrum) • Plant tissue is crushed in liquid nitrogen, and non cell wall components, such as proteins, are extracted using an SDS-Tris buffer • Cell walls are isolated by homogenization in a Geno-Grinder (SPEX Certi-Prep), collected on a nylon mesh and washed with water and ethanol • Cell walls are resuspended in distilled water and spotted on a gold-plated slide (EZ-Spot, Spectra-Tech) for spectral acquisition in an FTIR spectrometer (Thermo-Electron, Madison, WI )
FTIR spectral acquisition • Spectra are acquired in a range of 4000 to 650 cm–1; 1 spectrum consists of 128 co-added scans with an eight- wavenumber resolution • The following spectral characteristics are used to ensure that readings can be compared: • 0.4 to 0.8 max peak reading @ 1050-1000 cm-1 • Peak @ 1050-1000 cm-1 greater than peak @ 1600 cm-1 • The values @ 1800 cm-1 and 800 cm-1 are fairly equal with a value below 0.3 absorbance (to ensure a good baseline correction) • Noisy spectra are discarded
FTIR data analysis A • Fig. A: We collect many spectra (about 40) with a computer driven stage and Omnic software (Thermo Electron), saving them as grouped data (*.spa) • Fig. B: We convert group data to individual *.jdx files in Omnic B
FTIR data analysis • We use Win-Das (Kemsley, 1998)*software to analyze our data instead of Omnic because it is capable of area averaging the spectra, an essential feature of spectral analysis of plant cell walls because the samples vary in thickness • With the DOS command, RENAME, we convert *.jdx files into *.dx files that Win-Das software can recognize * Kemsley. 1998. Discriminant Analysis of Spectroscopic Data. Chichester, UK: John Wiley and Sons
FTIR data analysis • In Win-Das we first construct a matrix • We add all of our spectra (observations) • We view the spectra
FTIR data analysis • In Win-Das we: • Truncate the spectra from 1801.2 to 798.4 cm-1 (useful wavenumber range for cell wall molecules) • Baseline correct the spectra • Normalize the spectra and save as a .txt (spectra) or .wdd (analysis) file
FTIR data analysis • Saving data for the web • After normalizing we save the file as CF-Text (column-wise) • This generates a *.txt file we copy and paste into Excel
FTIR data analysis • You can download these spectra from our website (Families Tables) • You can average the spectra using the average command in Excel
FTIR data analysis • Digital subtraction • To perform a digital subtraction, average the mutant and wild-type spectra (previous slide) and copy over the spectra values (left column of spectra files) • Subtract mutant from wild type and plot versus wavenumber (cm-1) • Look for peaks (differences in cell wall components)
FTIR data analysis • Absorbances of specific peaks in the IR spectrum can be correlated with particular cell wall molecules (Kačuráková et al, 2000)*: • Cellulose: 1162, 1120, 1059, 1033, 930, and 898 cm-1 • Pectin: 1144, 1100, 1047, 1017, 953, 896 cm-1 • Rhamnogalacturonan: 1150, 1122, 1070, 1043, 989, 951, 916, 902 cm-1 • Xyloglucan: 1153, 1118, 1078, 1041, 945, 897 cm-1 • However, these peak assignments are based on isolated polysaccharides and peaks may shift depending on molecular interactions and environment within the cell wall • The more peaks that can be assigned to a particular polymer, the more likely that component differs between mutant and wild type cell walls * Kačuráková, Capek, Sasinková, Wellner, and Ebringerová. 2000. FT-IR study of plant cell wall model compounds: pectic polysaccharides and hemicelluloses. Carbohydrate Polymers 43:195- 203
FTIR data analysis • To develop Discriminant Analysis for our classifications (PCAs) in Win-Das • We create two groups (one wild type and one mutant) • We compress the data using the covariance method
FTIR data analysis • PCA analysis: • Cluster plot of separation by PCAs • Loading plots (difference in groups) • Discriminate • We use Squared Mahalanobis distance to see number of correct classifications
FTIR data analysis • PCA from Variance scores are shown in the gene family table… • Number of Principal Components (PCs) • Percent classified (75/80 = 93%)