FTIR Gas Analysis Module
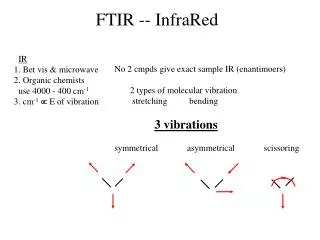
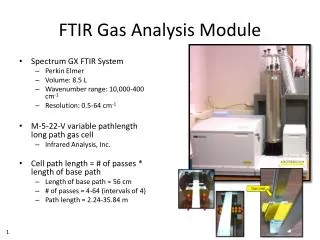
FTIR Gas Analysis Module. Spectrum GX FTIR System Perkin Elmer Volume: 8.5 L Wavenumber range: 10,000-400 cm -1 Resolution: 0.5-64 cm -1 M-5-22-V variable pathlength long path gas cell Infrared Analysis, Inc. Cell path length = # of passes * length of base path

FTIR Gas Analysis Module
E N D
Presentation Transcript
FTIR Gas Analysis Module • Spectrum GX FTIR System • Perkin Elmer • Volume: 8.5 L • Wavenumber range: 10,000-400 cm-1 • Resolution: 0.5-64 cm-1 • M-5-22-V variable pathlength long path gas cell • Infrared Analysis, Inc. • Cell path length = # of passes * length of base path • Length of base path = 56 cm • # of passes = 4-64 (intervals of 4) • Path length = 2.24-35.84 m 1
K. Nakamoto. Infrared and Raman Spectra of Inorganic and Coordination Compounds, Part A: Theory and Applications in Inorganic Chemistry. Wiley Publishing, 6th ed. (2009). IR Spectrum of H2O O • 3 modes of vibration • Bent triatomic molecule • k1 = 3657 cm-1 • k2 = 1595 cm-1 • k3 = 3756 cm-1 H H k1 = 3657 cm-1 O H H k2 = 1595 cm-1 O H H k3 = 3756 cm-1
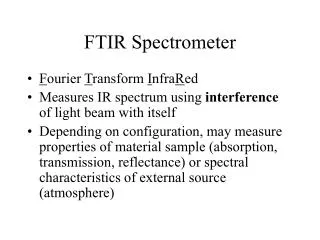
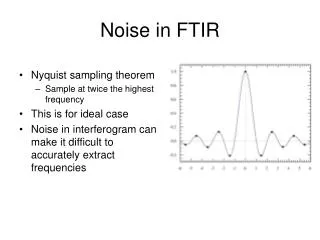
FTIR H2O Gas Analysis • Monitor wavenumber range: 2,000-1,200 cm-1 • Monitoring k2 vibration • Resolution: 0.5 cm-1 • Cell path length determines minimum detectable limit • Graph on next slide 4
FTIR H2O Minimum Detectable Limit Range provided to illustrate best case scenario (low) and worst case scenario (high), which is dependent on amount of H2O in background 5
Minimum Detectable Limit for H Concentration • Assumption: No source of hydrogen is available other than the sample: • From the stoichiometric relationship we have: H2O => 2H + ½O. • Detectable limit for H2O in gas (Ar+O2) at equilibrium is => 0.015- 0.05 which • is achieved by increasing the cell path length as high as ~ 20 m . • After this (0.015- 0.05 ppm H2O) the possible detectable limit gets saturated • (clear from the asymptotic shape of curve), i.e. after ~ 20 m of cell path • length, the increasing cell path length can’t give any significant increase for • the detectable limit of water. • H2O => 2H + ½O…. From this equation, the detectable limit for H gave up by • the sample in the gas (Ar+O2) at equilibrium should be 0.03- 0.1 ppm. • If we choose to use sample size of length of 6mm and diameter of 6mm, it • must give up 0.03 – 0.1 ppm of hydrogen into the circulating gas (Ar+O2) system • So, the actual volume of H given up by the sample is …. • = (0.03-0.1)*8.5 lit = (0.225- 0.85)*10-6 lit of H • Density of hydrogen = 0.08988 g/L. • So, the mass of hydrogen to be given up by the sample is = (0.225 -0.85)* 10-6 *ρH g. • H => (0.02- 0.07)* 10-6 g. H • Mass of 4340 sample with 6mm diameter and 6 mm length is = π (.3)2*0.6 *ρ4340 • => π(.3)2*0.6 * ρ4340= 3.14 * 0.09* 0.6 * 7.85 = 1.32 g • So, concentration limit of the sample has to be => (0.02-0.07)* 10-6g H/1.32 g sample • => (0.015 – 0.053)*10-6 • So, minimum detectable limit for H conc. in terms of sample mass = 0.015-0.053 ppm (µg/g)