Off-gas analysis
Off-gas analysis. Measurement of trace volatile organic compounds (VOCs) in fermentation off-gas has potential Advantages: Provide process indicator compounds Potential for on-line analysis Non-invasive Increase process understanding Disadvantages Low-level concentrations

Off-gas analysis
E N D
Presentation Transcript
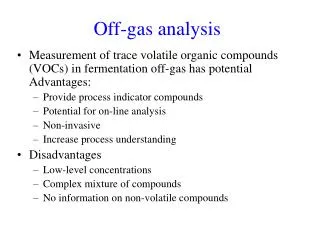
Off-gas analysis • Measurement of trace volatile organic compounds (VOCs) in fermentation off-gas has potential Advantages: • Provide process indicator compounds • Potential for on-line analysis • Non-invasive • Increase process understanding • Disadvantages • Low-level concentrations • Complex mixture of compounds • No information on non-volatile compounds
The process • Fermentation process at GSK, Worthing has been studied • Product is an antibiotic • 10 L development scale (Production scale can go up to 1000000L) • ~140 hour process • Currently off-gas analysed by process mass spectrometer for O2 and CO2
Sorbent sampling of VOC • Samples of fermentation off-gas were pumped through stainless steel sampling tubes packed with Tenax TA • Sources of compounds were assessed • Background or process? • Samples taken throughout reactions • Long sampling periods used to identify compounds • Shorter sampling periods used to ‘track’ compound changes • Standard and perturbed batches monitored
Pre-inoculation sample (3 hours) Mass spectra similar for main peaks Relative intensity (%) Process sample (0-4 hours) Retention time (minutes) Background compounds Indicates due to same compound By comparing chromatograms obtained when compounds are desorbed from the sample tubes, it is possible to determine which peaks come from compounds that could be related to the fermentation process. Mass spectrometry allows identification of the compounds.
Assessing source of compounds • Samples taken from • Raw materials • Empty vessel • Vessel with air supply • Process samples • Indicated that compounds trapped due to sources other than process • Allowed identification of compounds thought to be due to process
Process compounds Process peak (a) – 4-pyridone Process peak (b) – cyclopentanone Total ion current (×106) toluene n.b. zoomed in areas of chromatograms From comparisons of results obtained for different sampling times during the fermentation process, it was identified that cyclopentanone is generated during the fermentation process. This compound has been reported in other similar studies as indicated on the next slide.
Process compounds • Compounds identified that were thought to be due to process: cyclopentanone & 4-pyridone • Cyclopentanone reported in literature for other Streptomyces microorganisms1 1Scholler C., Gurtler H., Pedersen R., Molin S., Wilkins K., J., Agric. Food Chem., 2002, 50, 2615-2621
Summary • Results indicate that cyclopentanone in off-gas increases during reactions operated under standard conditions • Perturbed reaction shows different trend to standard batches and appears to drop-off at the end • Indicates that cyclopentanone could be a potential process indicator