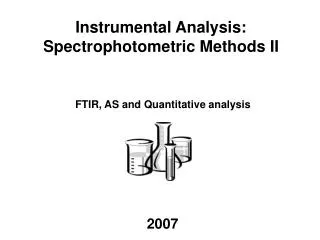
FTIR, AS and Quantitative analysis
Instrumental Analysis: Spectrophotometric Methods II. FTIR, AS and Quantitative analysis . 2007. By the end of this part of the course, you should be able to:. Understand interaction between light and matter (absorbance, excitation, emission, luminescence,fluorescence, phosphorescence)

FTIR, AS and Quantitative analysis
E N D
Presentation Transcript
Instrumental Analysis:Spectrophotometric Methods II FTIR, AS and Quantitative analysis 2007
By the end of this part of the course, you should be able to: • Understand interaction between light and matter (absorbance, excitation, emission, luminescence,fluorescence, phosphorescence) • Describe the main components of a spectrophotometer, (sources, monochromators, detectors, interferometer, grating, ATR, ICP, ) • Make calculations using Beer’s Law (analyse mixture absorption) • Understand the mechanism and application of UV-Vis, FTIR, Luminescence, atomic spectroscopy
Last week’s lecture: (Instruments based on light interaction with matter) • Properties of light • Molecular electronic structures • Interaction of photons with molecules • Spectrophotometer components • Light sources • Single and double beam instruments • Monochrometers • Detectors • Fluorescence spectroscopy • Today’s lecture: • Fourier transformed infrared spectroscopy • Interferometer • Atomic spectroscopy • Quantitative analysis • Beer’s law • Method validation • Dilution and spike
Beer’s law is the fundation for quantitative analytical chemistry Basic principles before Beer’s law Qualitative vs quantitative analysis What is inside and how much is inside? Sensitivity vs resolution How can we balance the sensitivity vs resolution? S/N ratio ratio control Improve the Signal/Noise ratio by repeat. Background correction Control the background (stabilise) and numerically subtract. Peak shape control Minimum artificial distortion. Chemical environment control Improve the reproducibility. Selectivity Improve the uniqueness of the quality analysis.
A A With constant c With constant b c b Beer’s law Absorption vs Transmittance Absorption A = ebc where b =>path length c =>molar concentration e =>molar absorptivity Transmittance T = P/Po where T => transmittance P => power of transmitted radiation Po => power of incident radiation %T = (P/Po)*100 Where %T => percent transmittance A = - log10T = - log10 (P/Po) and T=10-A Source b Readout Absorbance Sample Detector What is the units for A, b, c, T, P ande ?
or Cuvettes Cuvets
c o n c e n t r a t i o n ( c ) 1 0 0 % i. when c is small: Dc is also small but it is large proportion of c ii. when c is large: error now corresponds to a large uncertainty in c Error in Beer’s Law Spectrophotometric measurements involve: i. an adjustment for P/Po = 0 i.e. for no light through ii. an adjustment for P/Po = 100% i.e. for all the light through iii. an adjustment of P/Po with sample in place Scale the spectrometer Consider the effect of a 1% error in T (P/Po) 1% error DC P/Po % DC In practice: the measure A should be between: 1.0 (T = 10%) 0.1 (T = 79.4%) 1% error
Quantitative methods: Part 1. Methods validation: Specificity: the ability of a method to distinguish the analyte from others in the sampleCheck resolution Linearity: How well a calibration curve follows a straight line. Square of correlation coefficient Accuracy: nearness to truth,check with different methods and spiking Precision: reproducibility,standard deviation Range: concentration interval over which linearity, accuracy and precision are all good Detection Limits: defined by signal detection limit: 3s (standard deviation), minimum concentration: 3s/m, m is the slope of the linear curve.
Quantitative methods:Part 2: Dilution Concentration-dilution formulaA very versatile formula that you absolutely must know how to use How to prepare 100ml of 0.1M NaCl solution from 2.0M stock? Calculations: C1 V1 = C2 V2 where C = conc.; V = volume Cconc Vconc = Cdil Vdil where “conc” refers to the concentrated solution and “dil” refers to the dilute solution The total NaCl molecules: V1x2.0M =100mlx0.1M So, V1=100mlx0.1M/2.0M =5ml (needed from stock) How to do it: Chef: Chemist: transfer 5ml stock with a 5ml pipet into a 100ml volumetric flask. Topup to 100ml mark. Shake not stirred Measure 5ml of stock with teaspoon Add 95ml of water Can you tell the difference between a chef and a chemist?
The final concentration: Dilute unknown: (V1cx)/ V, absorbance A1 A1=eb (V1cx)/ V Spiked: (V1cx+v2c2)/ V, absorbance A2 A2=eb (V1cx+v2c2)/ V V1Cx V1Cx +V2C2 Diluted to V Quantitative methods:Part 3: spike: a known quantity of analyte add to the sample to test accuracy and linearity The unknown sample: V1, A1 Spiked with V2, c2 and A2. The solutions are diluted to volume V. Without dilution of the unknown unknown: (V1cx), absorbance A1 A1=eb (V1cx) Spiked: (V1cx+v2c2)/ V, absorbance A2 A2=eb (V1cx+v2c2)/ V (spike dilution) Absorbance difference A2-A1=ebV2c2/ V So the molar absorbance e can be measured, which will in turn give cx
Analysis of a mixture and isosbestic point A solution of mixture of M and N Pure N Pure M What is in my soup? A mixture of flavours. Fig. 14-14, pg. 345 Principles of Instrumental Analysis Fifth Edition, by Skoog-Holler-Nieman
Analysis of Mixtures of Absorbing Substances The interaction between substance A and B is so weak that the presence of A(B) does not affect the molar absorbance of B(A). A linear addition of individual absorbance is equal to the total absorbance. Assumption
Solution of Binary Mixture With twovariables Wavelength 1 Am,l1 = a1,l1*b*c1 + a2,l1*b*c2 Wavelength 2 Am,l2 = a1,l2*b*c1 + a2,l2*b*c2 In two equations Need two measurements at wavelength 1 and 2 How to get the answer c1 and c2? Simple, just eliminate c2 to get c1.
What happens if we do more than two wavelength measurements? Two vaiables in N equations Classically, we can solve each pairs of equation to get c1 and c2, then we average the c1 and c2 to reduce the errors in each measurment With computer, a least square fitting to find the best solution of c1 and c2 by minimising the standard deviation (least square). Finding Nemo (minimum) If the solution is a mixture of N substances, how many minimum measurements are required at different energy?
Analysis of a mixture: Isosbestic point Changing of experimental conditions A=e1bc1+e2bc2 When e1=e2=e A=eb(c1+c2)=ebc A is a function of c=(c1+c2), but not c1 or c2 individually If absorption curves at different conditions always cross at one wavelength, that cross point is called isosbestic point. This suggests: There are only two principal species in the solution. At this point, absorption coefficient are equal for different species in the solution. At this point, total concerntration can be measured.
P+X PX Analysis of mixture: equilibrium constant With constant total concerntration P0 A simple classical situation: Adding [X] to achieve different equilibrium (titration). Equilibrium constant k=[PX] [P][X] Complicated considerations: P, X and PX all have absorbance at l wavelength. Only P and PX have absorbance at l wavelength. Only PX has absorbance at l wavelength. P0=[P]+[PX] A=e1[P]+e2[X]+e3[PX] What we measure: [X], A Target: get rid off [P] and [PX] with a function of known A and [X] [P]=P0-[PX] A=e1P0- e1[PX] +e2[X]+e3[PX]
[PX]=(A-A0-e2[X]) e3-e1 k[P]=k{P0-(DA-e2[X])/ De31}= (DA-e2[X]) De31[X] Or: kP0-k(DA-e2[X])/ De31= (DA-e2[X]) y= (DA-e2[X]) x= (DA-e2[X])/ De31 De31[X] De31[X] k[P][X]=[PX] Analysis of mixture: equilibrium constant A=e1P0- e1[PX] +e2[X]+e3[PX] Here: A0= e1P0 Further more: DA=A-A0, De31= e3-e1 [P]=P0-[PX]=P0-(DA-e2[X])/ De31 At last: y Slope=-k x What is the intercept?
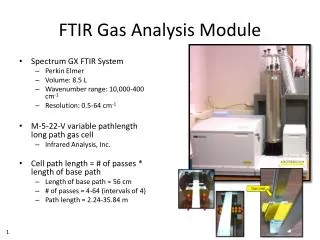
Fourier Transform Infrared Spectroscopy (FTIR) Traditional dispersive spectroscopy problems: Low sensitivity in IR Slow (relatively) low resolution FTIR Large optical throughout, high sensitivity Fast And high resolution Solution: Interferometer, mechanical modulation Jean-Baptiste-Josephde Fourier (1768-1830)
Key element of FTIR Michelson Interferometer Purpose: incident beam modulation through interference
Interference of waves In-phase: constructive Out-of-phase: destrictive
Michelson Interferometer • Mirror moves with Velocity V • Two beams recombine before detector • Monochromatic beam of frequency ngives an interferogram (cosine curve with wavelength proportional to 1/n) • The interferogram contains the spectrum of the source (reference sample) minus the spectrum of the sample -Recorded asintensity as a function of distance [I(d)] versus the distance (d) -V is usually 1.5 cm s-1 -To distinguish two frequencies n1 and n2: distance, d, ≥ 1/(n1 – n2)
Fourier Transform Infrared Spectroscopy Normal spectrum: plot of I(n) vs n Intensity as a function of frequencyvs.frequency Fourier transform: plot of I(t) vs t Intensity as a function of frequency vs frequency (remember: t = 1/n) Called the Fourier Transform of the frequency spectrum Spectrum may be collected in the frequencydomain as function of n or in the time domain as a function of t Each version of the spectrum contains the same information Conversion to one form to the other can be accomplished by a computer
Transfer interferogram to absorption spectrum FFT: Fast Fourier Transformation
Fourier Transform Infrared Spectroscopy - sample interferogram is transformed into sample spectrum - background spectrum is subtracted from sample spectrum
Atomic spectroscopy A tool for Quantitative and qualitative elementary analysis.
Number of spectral lines for each element can be large! Hydrogen Helium Mercury Uranium http://library.thinkquest.org/19662/low/eng/model-bohr.html Atomic Spectroscopy: Overview
Atomic Spectroscopy: Overview • Samples vaporized at 2000 – 6000 K decompose into atoms • Concentration of atoms in the vapor are measured • Very sensitive: ppm (mg/g) to ppt (pg/g) levels • Can measure up to 60 elements at a time: Molecular spectroscopy has a bandwidth of at least 10 nm Atomic spectroscopy has a bandwidth of 0.001 nm • 1 – 2% precision
Hollow-Cathode Lamps • Hollow-Cathode lamps (HCL) contains the vapor of the element of interest (i.e. Na) • Positive ions from a noble gas bombard the cathode and give metal atoms by sputtering • Metal atoms absorb energy by colliding with fast-moving filler gas ions, are elevated to excited electronic states, and return to ground state (emission) • Spectrum consist of discrete lines from the metal and gas (chosen so that interference is minimized) • The lines have a bandwidth of 0.001 nm • Atoms in the flame are mainly in the ground state Only those HCL lines terminating in the ground state can be used for absorption measurements • Lines are separated by a monochrometer • Sometimes can use the same lamp for 2 – 3 elements (e.g. Ca/Mg)
Simplest system: Flame Atomization • Nebulizer: converts the liquid into aerosol • Typical temperature of flame = 2200 ºC • Typical fuel: acetylene (can use H2) • Typical oxidant: air (can use N2O or O2)
Background Correction Background correction: A. Corrections performed by alternate sampling from the HCL & D2 lamp D2 lamp will give the background B. Alternatively, beam chopping or modulationof the HCL is used to distinguish between signal from flame (emission) and atomic lineof element Source is usually modulated (e.g. at 325 Hz) detector arranged so that only the modulated signal is recorded Modulation cuts down noise!
Inductively Coupled Plasma Spectrophotometer • Sample and Ar are aspirated into concentric quartz tubes surrounded by a lead coil • Inner tube has sample aerosol and Ar support gas • Outer tube has flow gas to keep the tubes cool • Oscillating current is produced in induction coil oscillating magnetic field is created • Magnetic field creates an oscillating current in the ions and electrons of the support gas (a plasma) • These ions and electrons collide with other atoms in the support gas • Temperatures of 6000 – 10000 K are generated • Atoms or ions are almost all excited emission rather than absorption is measured From: http://www.chemistry.adelaide.edu.au/external/soc-rel/content/icp.htm
Interference: An example Sn has to major emission lines at 189.927 nm and 235.485 nm
Interference: An example Sn has to major emission lines at 189.927 nm and 235.485 nm Which elements interfere at both wavelengths? Which wavelength is preferred for analysis?
V1Cx V1Cx +V2Cs Diluted to V Dealing with Interference: Standard Addition • Measure the absorbance (AX) of sample of unknown concentration (cX) • Add a known amount of standard to give a new concentration (cS) and measure new absorbance (AT) • From Beer’s Law: AX = k V1Cx /V AT = k(V1Cx + V2Cs)/V • For better accuracy add several different known amounts to generate a plot Slope =k / V Ax AT = k(V1Cx + V2Cs)/V • Intercept = -V1Cx 0 [Added analyte]=V2Cs
Some Practical Considerations Flame photometry is used when looking at the most sensitive spectral lines (looks at emission) > 300 – 350 nm (e.g. Na 589.0 nm, K 766.5 nm and Ca 422.7 nm) - good for relatively high concentrations Atomic Absorption Spectrophotometry: • Slightly more expensive than flame photometry, but can look at more elements • Good for relatively high concentrations (routine analysis) • Most AA spectrometers have facilities for recording emission spectra (HCL taken out of circuit) ICP • Many lines of varying intensity from both atoms and ions are available • Since dealing with hotter temperatures, can get more interference • BUT…. ICP gives sharper lines more elements can be measured at once with several slits and monochromators • VERY VERY SENSITIVE!!! NEED TO DILUTE ERROR
Some Practical Considerations: Temperature Effects • Number of atoms in the excited state is temperature dependent Boltzmann Distribution N/N0 = (g/g0) exp(-DE/kT) N, N0, g, g0 = #’s in and degeneracies of the excited and ground states DE = energy difference T = Temperature k = Boltzmann Constant (1.39 x 10⁻²³) e.g. Na: g1 = 6, g0 = 2 • At 2500 K, N/N0 = 1.74 x 10⁻⁴ • At 2510 K, N/N0 = 1.79 x 10⁻⁴ 4% difference!
What we have learned today: • Beer’s law, absorbance and transmittance • Explain why the most accurate data are obtained when the absorbance is between 0.1 and 1.0. • Quantitative methods, validation, dilution and spike. • Mixture analysis and isosbestic point • Explain with diagram how a FTIR spectrometer works • atomic emission and absorption spectrophotometers work • Describe an Inductively Coupled Plasma (ICP) spectrophotometer • Explain the use of a deuterium lamp to obtain background corrections in AAS • Explain the standard addition method • Explain why higher temperatures give stronger emission lines
Atomic and x-ray fluorescence For atomic spectroscopy, the light sources generally needs to be stronger than HCL in order to get a strong fluorescence signal - lasers commonly used (see http://science.howstuffworks.com/laser.htm for a nice description on how lasers work) - vacuum discharge vessels also used Sample needs to be viewed at an angle (generally 90) - differentiate between incident light (P) and fluorescence - prevent swamping out of the detector with the high intensity laser beam source sample F A detector Advantages: - much better sensitivity (up to 1000 times greater that atomic absorption) - can even count individual atoms (Mark Osborn looks at single molecules using fluorescence spectroscopy) - good for biological and medical applications
Incoming X-ray ejects an electron from an inner-shell • A lower energy X-ray is released when an electron replaces the lost inner-shell electron X-ray fluorescence • Similar to fluorescence, but uses X-rays instead of photons • Energy of the resulting X-ray is atom dependent • Number of characteristic X-rays is proportional to the concentration of the element
X-ray fluorescence uses • Non-destructive • Multi-element • Fast • Metallurgical industry • Geochemistry and mineralogy: qualitative and quantitative • Environmental science: measurement of sediments, aerosols, water • Paint industry: lead analysis • Jewellery: precious metals • Fuel industry: contaminant monitoring • Food industry: toxic metal analysis • Agriculture: trace metal analysis • Archaeology • Arts: analysis of paintings and sculptures • Lead analysis