Download
1 / 23
280 likes | 507 Vues
An Overview of Rule-Based Forecasting. Monica Adya Department of Management Marquette University Last Updated: April 3, 2004. Outline. Background of RBF what is RBF the development of RBF enhancements to RBF Elements of RBF Evidence on the value of RBF. What is RBF?.

E N D
An Overview of Rule-Based Forecasting Monica Adya Department of Management Marquette University Last Updated: April 3, 2004
Outline • Background of RBF • what is RBF • the development of RBF • enhancements to RBF • Elements of RBF • Evidence on the value of RBF
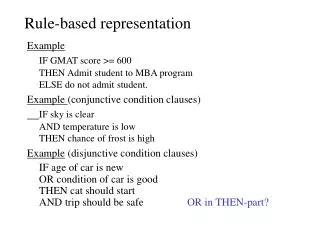
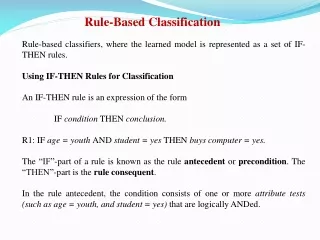
What is RBF? • Expert system that uses domain knowledge to combine forecasts • Production rules determine weights to be assigned to four component methods. • Rules rely on features of time series to suggest weights. • E.g. IF there is a change in the basic trend THEN add 15% to the weight on random walk AND subtract it from the other three methods.
Gathering Rules • Rules gathered from • literature • interviews and surveys of forecasters, and • protocol analysis of 5 experts. • Rules calibrated and tested on 90 time series. • Rules validated on 36 time series.
Formulating Rules • Separate considerations are given to level and trend • Simple extrapolation methods are used • Forecasts are combined • Different models are used for short and long term forecasts • As uncertainty increases, trend is damped
Structure of RBF Short-Range Model Level Trend Adjust Data Identify Features Blend short, long range forecasts Long-Range Model Level Trend Damping
The Features • The IF… part of the rules rely on features of time series • domain knowledge • historical features • RBF relies on 28 features
RBF uses 28 Features • Domain Knowledge • Causal Forces • Functional form • Cycles expected • Forecast horizon • Subject to events • Start-up series • Related to other series Historical Data • Uncertainty • Coeff of variation about trend • Basic and recent trends differ • Instability • Irrelevant early data • Suspicious pattern • Unstable recent trend • Outliers present • Recent run not long • Near a previous extreme • Changing basic trend • Level discontinuities • Last observation unusual • Types of Data • Only positive values • Bounded • Missing observations • Level • Biased • Trend • Direction of basic trend • Direction of recent trend • Significant basic trend • Length of series • Number of observations • Time interval • Seasonality
Causal Forces Type of Causal Force Direction when trend has Example CF been up been down Growth up up Sales Decay down down Production costs Regressing toward a known toward a known Inventory as % of mean value mean value sales Supporting up down Real estate prices Unknown ? ? Exchange rates
Triggering Rules using Features REINFORCING SERIES Balance basic and recent trends Y Forces consistent with trends? CONTRARY SERIES Heavy weight on RW with strong damping Basic & Recent same? N Y CONTRARY SERIES: SHORT Emphasis on basic trend and RW with moderate damping Y Forces consistent with basic trend? Y Forces Known? N CONTRARY SERIES: LONG Emphasis on the recent trend and RW with moderate damping N N Basic & Recent same? CONSISTENT TRENDS Balance basic & recent with little wt. on RW and moderate damping Y INCONSISTENT TRENDS Balance basic & recent with heavy wt. on RW and strong damping N
Trend Forecasting • Use full trend extrapolation for reinforcing series • Place little weight on trends in contrary series • If expected trends from causal forces are contrary to historically estimated trends, do not use the historical trend
Trend Forecasting (cont.) • Use a conservative trend estimate if the basic and recent trends are inconsistent • Tailor extrapolation weights to the time interval of the series • To estimate the levels for the short-term model, heavily weight the latest observations • Adjust the estimate of the level in the direction implied by the causal forces.
Evidence from RBFData From M-Competition Median Absolute Percentage Errors One-ahead forecastsSix-ahead forecasts MethodV1 V2 V3 W V1 V2 V3 W RW 6.4 5.7 5.6 5.8 30.1 24.7 25.2 26.0 TM 5.5 4.3 4.9 4.8 23.3 18.0 18.0 19.0 EW 2.8 3.1 4.3 3.5 22.8 21.9 18.4 20.7 RBF 2.5 3.1 3.2 3.0 13.0 9.1 14.2 11.9 (V1, V2, and V3 represent the three validation samples as used in Collopy and Armstrong, 1992. W represents the weighted average.)
Results of the M3 Competition • Annual Series • Short-term forecasts: RBF(A) wins over all other methods by small margin • Long term forecasts: RBF(A) wins over all methods by progressively wider margin • Overall - RBF(A) best method on annual data • Short Period Series • Short-term forecasts: RBF(A) ranks third. • Long-term forecasts: RBF(A) progressively improves till it is the best method. • Overall - RBF(A) ranks second.
When is RBF Useful? • Long-interval data are used • good domain knowledge is available • causal forces are clearly identifiable • domain knowledge conflicts with historical trend • long range forecasts are needed • significant trend exists • uncertainty is modest to low • instability is modest to low
Automatic Feature Identification • Objective of Automation • Consistent coding of features • Reduced costs: judgmental coding typically takes 4-5 minutes per series • Which features were automated? • Those that were visually determined - outliers, level discontinuity, unusual last observation, changing basic trend, unstable recent trend, and functional form. • How was feature identification automated? • Develop heuristics based on simple statistical procedures.
Development of the Heuristics • Developed on 70 series used to develop RBF. Validated on 52 series. • Identified a test that seemed most appropriate for the detection of the feature. • Produce forecasts for development and validation sample. • Compare forecast accuracy of RBF with judgmental and heuristic coding of features.
Automatic Identification Results • Forecast accuracies were not significantly harmed as a result of automated feature detection. • Significant reduction in coding time. • 30% of series performed the same on all horizons. • Of the remaining, as many series performed better with automated detection as did worse.
Weatherhead II consists of 456 series collected in 1995. Description of series in this sample can be found at • http://www-marketing.wharton.upenn.edu/forecast/researchers.html • The RBF(A) version of RBF includes the modules for automated feature identification.
Future Research • Address the issue of seasonality on short period data. • Further examination of feature identification heuristics. • Examine the impact of features on seasonality. • Sensitivity analysis on rules.
Suggested Resources • forecastingprinciples.com • Principles of forecasting: A handbook for researchers and practitioners, J.S. Armstrong [ed.], Kluwer Academic Press