Download
1 / 23
240 likes | 518 Vues
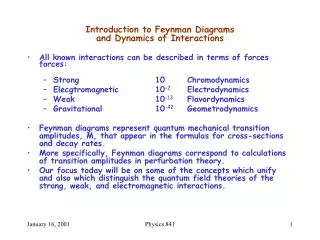
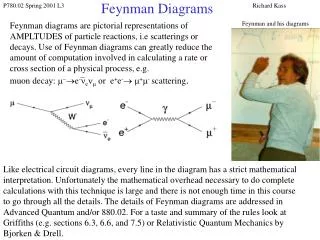
Feynman diagrams, RNA folding, and the transition polynomial. Yongwu Rong Department of Mathematics George Washington University RNA in Biology, Bioengineering and Nanotechnology IMA, October 29-November 2, 2007. Feynman Diagrams in Physics. Feynman Diagrams in Physics.

E N D
Feynman diagrams, RNA folding, and the transition polynomial Yongwu Rong Department of Mathematics George Washington University RNA in Biology, Bioengineering and Nanotechnology IMA, October 29-November 2, 2007
Feynman Diagram in Mathematics • Topology: Classify spaces in any dimension Dim = 1. Dim = 2. plus Klein bottles etc genus = # of handles. Dim = 3. Recently solved by Perelman. Dim > 3, proved to be impossible to classify (undecidable).
Feynman Diagrams in Mathematics Kelvin conjectured that atoms were knotted tubes of ether. Periodic Table of Elements? Knots:
Feynman Diagrams in Mathematics Knots: Singular knots: Chord diagram (Feynman diagrams) Came from Vassiliev invariants (part of Quantum Invariants)
Feynman Diagrams in Mathematics Can add, subtract, multiply Feynman diagrams. 2 After taking a “quotient,” get “M = space of Feynman diagrams” ~ “Space of Vassiliev Invariants.”
Feynman Diagrams in Mathematics • Conjecture. They classify all knots. • Conjecture. dim M ~ e n , as n infinity. • Can fit knots in M using “Kontsevich integral.” e.g. 1/12 11/24 5/24 1/8 1/8 1/12 higher order terms
Feynman Diagrams in Mathematics • If thechord don’t intersect each other, the diagram is planar. • These diagrams generate the so-called “Temperley-Lieb algebra” in statistical mechanics. • The number of such diagrams with n chords, i.e. dimension of “Temperley-Lieb algebra,” is the • “Catalan number.” • Example. n = 3. dim = 5.
Feynman Diagrams in Mathematics • In general, the chords may intersect each other, and therefore yields non-planar Feyman diagrams. • The extent of non-planarness can be measured by genus – the smallest genus of a surface it lies on. e.g. g = 1
Feynman Diagrams in Biology Watson-Crick pair: A-U, C-Gwobble pair: G-U. RNA Primary Structure: A C C U G U A G U A A U G A G U C U RNA secondary structure: RNA tertiary structure:
Feynman Diagrams in Biology Secondary structures are coded by Feynman diagrams: Secondary structure without pseudoknots:
Feynman Diagrams in Biology Secondary structures are coded by Feynman diagrams: Secondary structure pseudoknots:
Feynman Diagram in Biology Basic Questions:Given primary structure of an RNA, determines its secondary structure, and tertiary structure that minimizes the “energy.” Often, energy = free energy from pairing + stacking energy.
Feynman Diagram in Biology Partition function summed over all possible Feynman diagrams D. (Compare to Kontsevitch integral). This gives the probability distribution of states. The one with minimum volume has the highest probability.
H. Orland, M. Pillsbury, A. Taylor, G. Vernizzi, A. Zee reformulated the RNA folding problem as an N × N matrix field theory. The terms in the partition function are classified according to their topological character. In particular, the genus of a Feynman diagram plays an important role. • For more details, see talk by Henri Orland tomorrow. • Our work: • Classified all genus one Feynman diagrams. • Introduced a “transition polynomial” which contains some useful topological information such as genus.
Feynman Diagram in Biology Pillsbury, Orland, Zee (2005) classified all genus one irredubile pseudoknot using “Matrix Field Theory,” eight of them total.
g = 1 a And plus trivial chords, All have genus = 1 b c Proposition. (Luse – R.) These are all Feynman diagrams with genus = 1.
The “transition polynomial” for 4-valent planar-graphs was introduced by F. Jaeger. Its description is as follows. • Given a 4-regular planar graph G, color its complementary regions B or W so that the infinite region is W. • At each vertex v, there are three possible “transitions” at v.
But 4-regular planar graphs can be translated to Feynman diagrams. e.g. Try to translate “transitions” to Feynman diagrams. Need “signed Feynman diagrams.”
We define a transition polynomial for signed Feynman diagrams. • Properties. Let D be a Feynman diagram on n chords. Then • Q (D, x, y, z, 1) = (x + y + z)n • Q (D # D’) = Q(D) Q(D’) • If each chord of D has a positive sign, then • Q(D, 0, 1, 0, w) = wc-1, and genus (D) = ½ (n + 1 – c). • Further properties to be investigated: • Relation with graph polynomials (chromatic, Tutte, Penrose…) • Relations with knot polynomials (Jones, Kauffman bracket …) • Geometric meaning? Physical / biological meaning?