Telecommunication Systems 1
Telecommunication Systems 1. Prof. Dr. Tayfun Akgül. COMMUNICATION ENGINEERING. Course Code : ISE 3 01 Course title : Telecommunication Systems Credit Hours : 3 Semester : Fall 200 9

Telecommunication Systems 1
E N D
Presentation Transcript
Telecommunication Systems1 Prof. Dr. Tayfun Akgül
COMMUNICATION ENGINEERING • Course Code:ISE301 • Course title : Telecommunication Systems • Credit Hours: 3 • Semester:Fall 2009 • Instructor: Prof.Dr. Tayfun AKGÜL • Course Page : http://atlas.cc.itu.edu.tr/~akgultay/ • Refernece Book :A.B.Carlson, P.B. Crilly, J.C. Rutledge, “Communication Systems,” McGraw-Hill, 4th Edition, 2002.
Syllabus - I • Introduction to Signals • General Topics in Communications and Modulation • Spectral Analysis • Fourier Series • Fourier Transform • Frequency Domain Representation of Finite Energy Signals and Periodic Signals • Signal Energy and Energy Spectral Density • Signal Power and Power Spectral Density • Signal Transmission through a Linear System • Convolution Integral and Transfer Function • Ideal and Practical Filters • Signal Distortion over a Communication Channel
Syllabus - II • Amplitude (Linear) Modulation (AM) • Amplitude Modulation (AM) • Double Side Band Suppressed Carrier (DSBSC) • Single Side Band (SSB) • Vestigial Side Band (VSB) • AM Modulator and Demodulator Circuits • AM transmitter block diagram • Angle (Exponential) Modulation • Phase Modulation (PM) • Frequency Modulation (FM) • Modulation Index • Spectrum of FM Signals • Relationship between PM and FM • FM Modulator and Demodulator Circuits • FM Transmitter Block Diagram • FM Receiver
Signals and Systems Signals and Systems What is a signal? Signal Basics Analog / Digital Signals Real vs Complex Periodic vs. Aperiodic Bounded vs. Unbounded Causal vs. Noncausal Even vs. Odd Power vs. Energy What is a communications system? Block Diagram Why go to higher frequencies? Telecommunication Wireless Communication Another Classification of Signals (Waveforms) Power, Distortion, Noise Shannon Capacity How transmissions flow over media Coaxial Cable Unshielded Twisted Pair Glass Media Wireless Connectors The Bands Outline
Signal and System • Signals are variables that carry information • System is an assemblage of entities/objects, real or abstract, comprising a whole with each every component/element interacting or related to another one. Systems process input signals to produce output signals • Examples • Motion, sound, picture, video, traffic light… • Natural system (ecosystem), human-made system (machines, computer storage system), abstract system (traffic, computer programs), descriptive system (plans)
Signal Examples • Electrical signals --- voltages and currents in a circuit • Acoustic signals --- audio or speech signals (analog ordigital) • Video signals --- intensity variations in an image (e.g. aCAT scan) • Biological signals --- sequence of bases in a gene • Noise: unwanted signal :
Measuring Signals Amplitude Period
Definitions • Voltage – the force which moves an electrical current against resistance • Waveform – the shape of the signal (previous slide is a sine wave) derived from its amplitude and frequency over a fixed time (other waveform is the square wave) • Amplitude – the maximum value of a signal, measured from its average state • Frequency (pitch) – the number of cycles produced in a second – Hertz (Hz). Relate this to the speed of a processor eg 1.4GigaHertz or 1.4 billion cycles per second
Signal Basics • Continuous time (CT) and discrete time (DT) signals CT signals take on real or complex values as a function of anindependentvariable that ranges over the real numbers and aredenoted as x(t). • DT signals take on real or complex values as a function of an independentvariable that ranges over the integers and are denoted as x[n]. • Note the subtle use of parentheses and square brackets to distinguish between CT and DT signals.
Analog Signals • Human Voice – best example • Ear recognises sounds 20KHz or less • AM Radio – 535KHz to 1605KHz • FM Radio – 88MHz to 108MHz
Digital signals • Represented by Square Wave • All data represented by binary values • Single Binary Digit – Bit • Transmission of contiguous group of bits is a bit stream • Not all decimal values can be represented by binary
Analogue vs. Digital Analogue Advantages • Best suited for audio and video • Consume less bandwidth • Available world wide • Less susceptible to noise Digital Advantages • Best for computer data • Can be easily compressed • Can be encrypted • Equipment is more common and less expensive • Can provide better clarity
Analog or Digital • Analog Message: continuous in amplitude and over time • AM, FM for voice sound • Traditional TV for analog video • First generation cellular phone (analog mode) • Record player • Digital message: 0 or 1, or discrete value • VCD, DVD • 2G/3G cellular phone • Data on your disk • Your grade • Digital age: why digital communication will prevail
A/D and D/A • Analog to Digital conversion; Digital to Analog conversion • Gateway from the communication device to the channel • Nyquist Sampling theorem • From time domain: If the highest frequency in the signal is B Hz, the signal can be reconstructed from its samples, taken at a rate not less than 2B samples per second
A/D and D/A • Quantization • From amplitude domain • N bit quantization, L intervals L=2N • Usually 8 to 16 bits • Error Performance: Signal to noise ratio
Real vs. Complex • Q. Why do we deal with complex signals? • A. They are often analytically simpler to deal with than real signals, especially in digital communications.
Periodic vs. Aperiodic Signals • Periodic signals have the property that x(t + T) = x(t) for all t. • The smallest value of T that satisfies the definition is called the period. • Shown below are an aperiodic signal (left) and a periodic signal (right).
Causal vs. Non-causal • A causal signal is zero for t < 0 and an non-causal signal is zero for t > 0 • Right- and left-sided signals • A right-sided signal is zero for t < T and a left-sided signal is zero for t > T where T can be positive or negative.
Bounded vs. Unbounded • Every system is bounded, but meaningful signal is always bounded
Even vs. Odd • Even signals xe(t) and odd signals xo(t) are defined as • xe(t) = xe(−t) and xo(t) = −xo(−t). • Any signal is a sum of unique odd and even signals. Using • x(t) = xe(t)+xo(t) and x(−t) = xe(t) − xo(t), yields • xe(t) =0.5(x(t)+x(−t)) and xo(t) =0.5(x(t) − x(−t)).
Signal Properties: Terminology • Waveform • Time-average operator • Periodicity • DC value • Power • RMS Value • Normalized Power • Normalized Energy
Power Signal Infinite duration Normalized power is finite and non-zero Normalized energy averaged over infinite time is infinite Mathematically tractable Energy Signal Finite duration Normalized energy is finite and non-zero Normalized power averaged over infinite time is zero Physically realizable Power and Energy Signals • Although “real” signals are energy signals, we analyze them pretending they are power signals!
The Decibel (dB) • Measure of power transfer • 1 dB = 10 log10 (Pout / Pin) • 1 dBm = 10 log10 (P / 10-3) where P is in Watts • 1 dBmV = 20 log10 (V / 10-3) where V is in Volts
B A Engineering System Social System Genetic System Communication System History and fact of communication
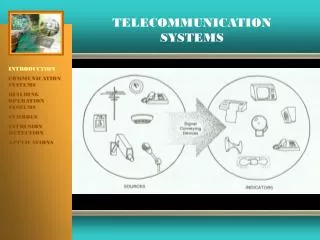
Info Sink Info Source Comm System What is a communications system? • Communications Systems: Systems designed to transmit and receive information
Info Source m(t) message from source n(t) noise Receiver Rx Transmitter Tx Channel received message to sink s(t) transmitted signal r(t) received signal Block Diagram Info Sink
Telecommunication • Telegraph • Fixed line telephone • Cable • Wired networks • Internet • Fiber communications • Communication bus inside computers to communicate between CPU and memory
Wireless Comm Evolution: UMTS (3G) http://www.3g-generation.com/ http://www.nttdocomo.com/reports/010902_ir_presentation_january.pdf
Wireless Communications • Satellite • TV • Cordless phone • Cellular phone • Wireless LAN, WIFI • Wireless MAN, WIMAX • Bluetooth • Ultra Wide Band • Wireless Laser • Microwave • GPS • Ad hoc/Sensor Networks
Baseband Signal Baseband Signal Bandpass Signal Demodulation or Detection Modulation Comm. Sys. Bock Diagram Noise Channel Rx m(t) Tx r(t) s(t) • “Low” Frequencies • <20 kHz • Original data rate • “High” Frequencies • >300 kHz • Transmission data rate Formal definitions will be provided later
Aside: Why go to higher frequencies? Half-wave dipole antenna c = f l c = 3E+08 ms-1 Calculate l for f = 5 kHz f = 300 kHz Tx l/2 There are also other reasons for going from baseband to bandpass
Deterministic Signals: Can be modeled as a completely specified function of time Random or Stochastic Signals: Cannot be completely specified as a function of time; must be modeled probabilistically What type of signals are information bearing? Another Classification of Signals (Waveforms)
Power, Distortion, Noise • Transmit power • Constrained by device, battery, health issue, etc. • Channel responses to different frequency and different time • Satellite: almost flat over frequency, change slightly over time • Cable or line: response very different over frequency, change slightly over time. • Fiber: perfect • Wireless: worst. Multipath reflection causes fluctuation in frequency response. Doppler shift causes fluctuation over time • Noise and interference • AWGN: AdditiveWhiteGaussian noise • Interferences: power line, microwave, other users (CDMA phone)
Shannon Capacity • Shannon Theory • It establishes that given a noisy channel with information capacity C and information transmitted at a rate R, then if R<C, there exists a coding technique which allows the probability of error at the receiver to be made arbitrarily small. This means that theoretically, it is possible to transmit information without error up to a limit, C. • The converse is also important. If R>C, the probability of error at the receiver increases without bound as the rate is increased. So no useful information can be transmitted beyond the channel capacity. The theorem does not address the rare situation in which rate and capacity are equal. • Shannon Capacity
How transmissions flow over media • Simplex – only in one direction • Half-Duplex – Travels in either direction, but not both directions at the same time • Full-Duplex – can travel in either direction simultaneously
Coaxial Cable • First type of networking media used • Available in different types (RG-6 – Cable TV, RG58/U – Thin Ethernet, RG8 – Thick Ethernet • Largely replaced by twisted pair for networks
Unshielded Twisted Pair • Advantages • Inexpensive • Easy to terminate • Widely used, tested • Supports many network types • Disadvantages • Susceptible to interference • Prone to damage during installation • Distance limitations not understood or followed
Glass Media • Advantages • Can be installed over long distances • Provides large amounts of bandwidth • Not susceptible to EMI RFI • Can not be easily tapped (secure) • Core of silica, extruded glass or plastic • Single-mode is 0.06 of a micron in diameter • Multimode = 0.5 microns • Cladding can be Kevlar, fibreglass or even steel • Outer coating made from fire-proof plastic • Disadvantages • Most expensive media to purchase and install • Rigorous guidelines for installation
Wireless (2) • Radio transmits at 10KHz to 1KHz • Microwaves transmit at 1GHz to 500GHz • Infrared transmits at 500GHz to 1THz • Radio transmission may include: • Narrow band • High-powered • Frequency hopping spread spectrum (the hop is controlled by accurate timing) • Direct-sequence-modulation spread spectrum (uses multiple frequencies at the same time, transmitting data in ‘chips’ at high speed)
Connectors Fibre Optic RJ45 Token Ring Thicknet T-Piece
The Bands 3KHz 30KHz 300KHz 3MHz 30MHz 300MHz 3GHz 30GHz 300GHz 3THz ELF VLF LF MF HF VHF UHF SHF EHF Far Infra- Red Submillimeter Range Radio Optical 300mm 1500nm 1PetaHz 1ExaHz Near Infra- Red R e d O r a n g e Y e l l o w G r e e n B l u e I n d i g o V i o l e t Ultraviolet X-Ray 700nm 600nm 500nm 400nm