Mathematical Models Chapter 2
Mathematical Models Chapter 2. By Mr. Leavings. And just what are we going to LEARN ?. Construct a speed vs. distance graph Use graphs to make predictions Determine the slope of a line (gives you V!) Distinguish between speed and acceleration Calculate acceleration from a formula

Mathematical Models Chapter 2
E N D
Presentation Transcript
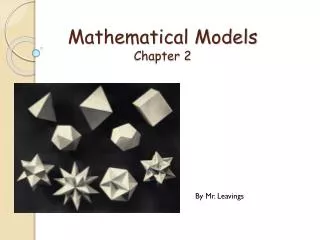
Mathematical ModelsChapter 2 By Mr. Leavings
And just what are we going to LEARN? • Construct a speed vs. distance graph • Use graphs to make predictions • Determine the slope of a line (gives you V!) • Distinguish between speed and acceleration • Calculate acceleration from a formula • Calculate acceleration from the slope of a speed vs. time graph
Mathematical Models Why would you want to make a model? To answer complicated questions it is easier to break down the problem into more manageable pieces. • Example from your reading: Building a train. • How powerful of a motor do we need? • How strong of brakes to stop the train? • How much fuel to travel the distance required?
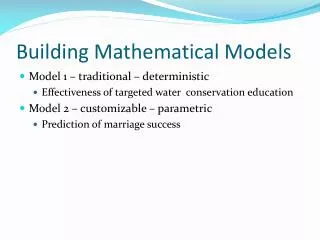
Scientific Models Scientific Model: a model that shows how each variable relates to one another 3 Types: Physical Models Conceptual Models Graphical Models
Physical Models We can look, touch, feel and take measurements from them Often constructed in scale
Conceptual Models These types of models are descriptive. We use them to describe how something works.
Graphical Models Graphical Models: use graphs to show the relationship between the variable on the x axis and the variable on the y axis.
Graphical Models Dependent Variable: the measurement that changes based on the independent variable. Also the data that we measure. Independent Variable: the measurement that we change to determine its effect on the dependent variable. Independent variable ALWAYS placed on the x axis! Dependent Variable is ALWAYS placed on the y axis!
Predicting from Graphs The purpose of making a graph is to organize your data into a model so that you can make predictions.
Cause and Effect Strong Relationship Weak Relationship
Cause and Effect No Relationship Inverse Relationship
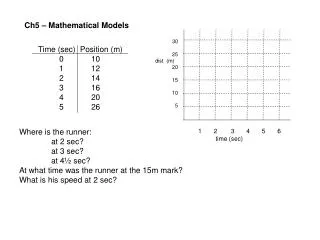
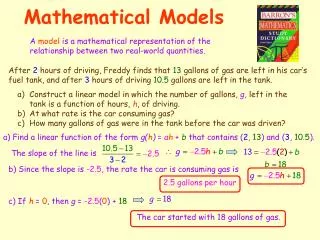
Position and Distance • Position- a comparison from starting point, includes direction. • Distance- an interval of length without regard to direction.
Determining Speed • Slope is the ratio of “rise” (vertical change) to the “run” (horizontal change) of a line. • The rise is determined by finding the height of the triangle shown. • The run is determined by finding the length along the base of the triangle.
Acceleration • Acceleration = the rate of change in speed of an object • =change in speed • change in time
Acceleration What units are acceleration in? Lets find out: Acceleration=change in speed change in time Meters/second ___________ Acceleration = Second Meters/Second2
Acceleration ∆V Delta V (∆V) is the change in velocity of an object. ∆V = Vf - Vi Where Vf stands for the final velocity and Vi stands for the initial velocity.
Acceleration ___∆V___ t a = OR __Vf - Vi __ t a =
Acceleration Manipulating the equation __Vf - Vi __ t a = then __Vf - Vi __ a t = and Vf = Vi + at Vi = Vf- at