Scientific Data Annotation and Analysis
Data annotation is crucial for enhancing scientific research, allowing for better data sharing and integration. It involves labeling measurements, adding structure, and recording provenance to improve data quality. Processing techniques minimize irrelevant variation and address missing values, ensuring reliable analysis. Ontologies and controlled vocabularies aid in structuring data, facilitating better information retrieval. This lecture explores the tools and methodologies in data preparation, normalization, filtering, and handling missing data to support scientists in deriving meaningful insights and knowledge from their data.


Scientific Data Annotation and Analysis
E N D
Presentation Transcript
Scientific Data Annotation and Analysis Lecture 7
Data Annotation, Processing, and Analysis Data are expensive to gather and confounded by noise, but they are the primary means of validation in the sciences. Data annotation helps scientists effectively share their data and maximize its use in knowledge discovery. Processing steps help control the quality of the data by reducing irrelevant variation and handling missing values. Data analysis helps scientists form conjectures about their data and identify hidden relationships. Informatics tools can support each of these activities, although tools for analysis receive the most attention.
Data Annotation Data annotation includes several activities, such as • labeling measurements, • adding structure to data, • describing the collection environment, and • recording provenance. This information enhances the use of scientific data in collaborative environments and enables data integration. Shared, controlled vocabularies let scientists communicate how and why data were collected to reduce data misuse. In some cases the annotations supplant the original observations to become a new form of scientific data.
Ontologies Controlled vocabularies are a collection of established terms used for annotation. Ontologies go further by structuring terms into classes, their instances, attributes with allowed values, and relations. The is-a and part-of relations often have special status and impose hierarchical structures on the classes. For example, a neutron • is-a subatomic particle, (relation) • is part-of the nucleus, and (relation) • has-charge 0e. (attribute) In this manner, classes are defined by their attributes and relations in a way that supports automated reasoning.
Ontology Creation There are several ontology formalisms including CycL, frame languages, and OWL (the Web Ontology Language) Informatics tools like Protégé enable ontology design and development without familiarity with a specific language. Collaborative tools such as BioPortal let scientists • search available ontologies, • visualize their structure, • comment on their contents, and • map concepts between ontologies. These tools initiate the larger scientific populace into the means and ends of knowledge representation.
Data Sources That Use Ontologies Several data sources use ontologies to facilitate information retrieval and data sharing on the web: • Protein Data Bank, • Mouse Genome Informatics, • FlyBase (Drosophila), • VectorBase (disease carriers), • ZFIN (Zebra Fish), and many others. Note that biology and biomedicine are the informal testing grounds for ontologies in scientific practice.
Editing an Ontology with Protégé http://protege.stanford.edu/
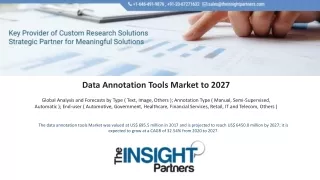
Visualizing an Ontology in BioPortal http://bioportal.bioontology.org/
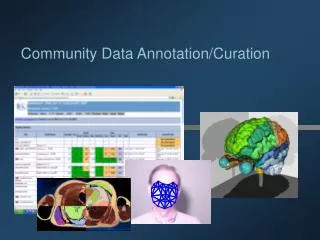
Using Annotations Annotated data serves several purposes such as • enhancing traditional information retrieval approaches with shared knowledge of concepts and relationships; • tracking the source an original use of scientific data to facilitate proper interpretation and use by third parties; • creating a new, structured representation of the data that scientists can reason about. The Video Annotation and Reference System (VARS) enables these capabilities and more. Using an ontology, researchers describe video of observed entities, their location, and other properties. VARS was designed for marine biologists, but the use of an explicit ontology simplifies customization to other fields.
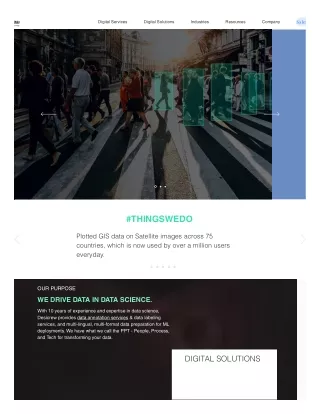
Annotating Video Records with VARS http://vars.sourceforge.net/
Data Preparation Observations often require processing before serving as scientific data. Even then, data may require further preparation before analysis such as • normalizing the data to enable the comparison of results across experiments; • filtering the data to enhance the signal; and • estimating the values of missing observations. When correctly applied, these steps help ensure the reliability of scientific results.
Data Normalization and Filtering Normalization counters systematic and uninformative variation in measurement tools and measured entities. • Normalization of fMRI data maps individual results to an “average” brain to enable comparison across people. • Normalization of microarray data combats incidental variation across experimental settings. • Normalizations may also transform data to fit a normal distribution to support the use of statistical analyses. Filters remove unreliable data and irrelevant noise by scanning for outliers, smoothing trajectories, etc. Informatics tools for filtering and normalization are often problem specific (caGEDA for microarrays, FIASCO for fMRI, ProMAX for seismic data).
Handling Missing Data Missing data can skew the distribution of a sample: • some values may be more difficult to detect than others; • removing observations with missing values may result in a biased sample. Imputation involves estimating the missing values: • substituting the mean is no longer encouraged; • for series data, interpolation fits a (localized) curve to the data set and estimates the missing values from it; • maximum likelihood estimation and multiple imputation are the most common approaches. Imputation builds a (typically shallow) underlying model of the available data that provides the missing values. SPSS, SAS, and R include imputation routines.
Data Analysis Analysis tools can reveal the patterns and relationships hidden within a scientific data set. Abstract views of these relationships are gathered through a combination of • descriptive statistics, • correlation tables, and • exploratory data analysis. These analyses describe the key characteristics of data sets, helping scientists form conjectures. Informatics tools supporting these analyses include Excel, SPSS, Minitab, and R.
Descriptive Statistics and Correlations Descriptive statistics include quantitative measures of • central tendency (e.g., mean, median), • variability (e.g., range, standard deviation), and • skewness (whether a distribution leans to one direction). Correlation tables identify linear relationships between variables in a multivariate data set. The correlation coefficient ranges between -1.0 and 1.0 and provides heuristic evidence for interesting interactions. Example distributions and their correlation coefficients.
Exploratory Data Analysis Exploratory data analysis includes a collection of techniques designed to • identify potential causal factors in a data set; • locate outliers for analysis or removal; and • produce other general intuitions about the data. These techniques complement statistical approaches to testing hypotheses and providing quantitative summaries. Informatics support for exploratory data analysis includes: • Data Desk, • SOCR, and • JMP.
Exploratory Data Analysis Exploratory data analysis favors graphical techniques that reveal trends in the data. Autocorrelation plots reveal interactions between measurements in time series. Boxplots reveal the effect of alternative conditions on sample distributions. Histograms illustrates the distribution of a single variable and reveals the number of modes, its skewness, and its spread.
Data Annotation and Analysis: Summary Data annotation assists primarily in information retrieval, but it has potential for data and knowledge integration. Ontology-based annotation is moving from basic research to routine practice especially in biology. However, we need rich informatics tools that use the well established knowledge bases such as the Gene Ontology. Software for data processing is becoming more common, but different types of data have different needs. General informatics tools that are readily specialized to particular sciences could address this situation. Data analysis tools are ubiquitous and valuable for scientists, but proper application remains a problem.