Debugging : Using the Stack Trace
Learn how to debug effectively in NetBeans using the debugger. Insert System.out.print statements, set breakpoints, step through the program, view variables, and utilize watches for efficient debugging. Essential guide for developers.

Debugging : Using the Stack Trace
E N D
Presentation Transcript
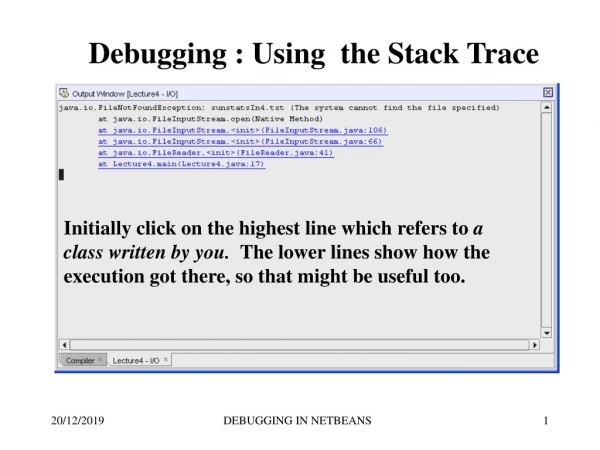
Debugging : Using the Stack Trace Initially click on the highest line which refers to a class written by you. The lower lines show how the execution got there, so that might be useful too. DEBUGGING IN NETBEANS
DEBUGGING : Inserting System.out.print statements • Simple and effective debugging technique if used intelligently • Use to check whether a block of code is ever executed System.out.println("got here"); • Use to check the value of a variable System.out.println(“number is “+num); • Essential to remove debugging statements from final version of program DEBUGGING IN NETBEANS
USING THE NETBEANS DEBUGGER : 1 Finish Step into Step out Run in Debugger Step over Continue Use the Debug menu or the buttons at the right hand side of the toolbar. You can watch how your program executes and how the variables change as the code is executed. DEBUGGING IN NETBEANS
USING THE NETBEANS DEBUGGER : 2 • A breakpoint is a line where you want execution to stop • Insert breakpoints at or before problem code • click in left margin of source editor and line is highlighted in red, and red square appears in margin • Run the program in the debugger (Debug : start session), program will stop at breakpoint • Variables are declared in windows at left and can be expanded • Ensure that the toggle switch to show private is on DEBUGGING IN NETBEANS
USING THE NETBEANS DEBUGGER : 3 • Stepping through a program • Step Over (F8) to move from one line of a method to the next (see how variables change) • Step Into (F7) to move into one of your own methods (but NOT into java methods) • Step Out to move out of a method to the statement after the method call • Continue to run to the next break point • Finish to stop the debugger DEBUGGING IN NETBEANS
USING THE NETBEANS DEBUGGER : 4 • Local variables are displayed in the Local Variables window • A Watch is a variable or expression whose value is displayed in the Watch window • lets you easily see how its value changes as the code is executed • to set a watch • rightclick on the variable or expression you want to watch • select New Watch from the drop down menu • in the dialog box fill in correctly the variable or expression • Hover mouse over variable in Source Editor to see current value in a tooltip • only works for variables/expressions currently in scope • sometimes doesn’t seem to work even for them ! DEBUGGING IN NETBEANS