Download
1 / 19
190 likes | 207 Vues
This study evaluates the health and economic impacts of air pollution caused by heat waves, stagnation, and compound extremes in the U.S., both currently (2001-2010) and in the future (2046-2055). It assesses the effects on air quality, climate change, health risks, and economic costs, using the Representative Concentration Pathways (RCP) 4.5/8.5 climate scenarios. The study also analyzes the occurrence of weather extremes and their impacts on ozone (O3) and PM2.5 pollution, as well as the associated mortality rates and costs.

E N D
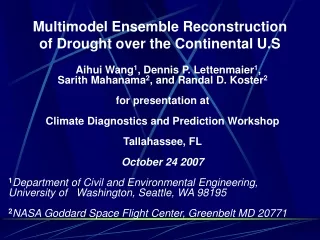
Health and Economic Impacts of Air Pollution Induced by Weather Extremes over the Continental U.S. Yang Zhang1, Peilin Yang1, Yang Gao2, Ruby L. Leung3, and Michelle L. Bell4 1North Carolina State University, Raleigh, NC, U.S.A. 2Ocean University of China, Qingdao, China 3Pacific Northwest National Laboratory, Richland, WA, U.S.A. 4Yale University, New Haven, CT, U.S.A. The 18th Annual CMAS Conference, October 21-23, 2019, Chapel Hill, NC
Acknowledgements • This research was performed at NCSU and funded under Assistance Agreement No. RD835871 by the U.S. Environmental Protection Agency to Yale University through Air, Energy, and Climate (AEC) program at the SEARCH (Solutions for Energy, AiR, Climate, and Health) Center. It has not been formally reviewed by EPA. The views expressed in this document are solely those of the SEARCH Center and do not necessarily reflect those of the Agency. EPA does not endorse any products or commercial services mentioned in this publication. • Thanks to Kai Wang at NCSU who developed the script to convert the WRF/Chem results into the format required by BenMAP-CE. Thanks to Junxi Zhang at Zhejiang University for generating the plots of model evaluation and spatial distribution of extreme events. • WRF/Chem outputs were generated under the U.S. NSF EaSM program (AGS-1049200). WRF/Chem simulations were performed under high-performance computing support from Yellowstone (ark:/85065/d7wd3xhc) provided by NCAR's Computational and Information Systems Laboratory, sponsored by the NSF and Information Systems Laboratory. The WRF/Chem results were processed and reformatted using the National Supercomputer TACC/NSF Stampede 2, provided as an Extreme Science and Engineering Discovery Environment (XSEDE) digital service by the Texas Advanced Computing Center (TACC) (http://www.tacc.utexas.edu), which is supported by National Science Foundation grant number ACI-1053575.
Background and Objectives • Background • Air pollution is the world’s largest single environmental health risk, with increasing public awareness • Extreme weather events may enhance O3and PM2.5pollution, causing additional adverse health effects • Objectives • Provide an integrated assessment of air pollution, climate change, health risks, and economic costs for current (2001-2010) and future (2046-2055) periods • Evaluate health and associated economic impacts of changes in air quality induced by heat wave, stagnation, and compound extremes under the Representative Concentration Pathways (RCP) 4.5/8.5 climate scenarios Weather Extremes: HW, St, CE (CIE= HW +St+CE)
Health Impact Functions HA: Hospital Admission. For all the HIFs, the coefficient varies from different epidemiological studies.
Weather Extremes and Impacts on Air Quality in Current and Future(2046-2055) and Current (2001-2010)The Weather Research and Forecasting Model with Chemistry (WRF/Chem)
The Occurrence (%) of HW, St, and CE RCP8.5 RCP4.5 2001-2010 2046-2055 2001-2010 2046-2055 3.4% 0.8% 2.9% 0.8% Heat wave only 14% 13% 14% 13% Stagnation only Compound event 0.5% 2.0% 1.9% 0.5% • St occurs most frequently (13-14%) in current/future under both scenarios • HW and CE only occur on 0.5-0.8% in current but increase to 2-3% in future • St is more frequent whereas HW and CE are infrequent but more intense
Impacts of Weather Extremes on Max 8-h O3under RCP8.5 • HW has larger effects than stagnation in enhancing O3 • CE yields larger effect (10-20 ppbv > sum of HW and St effects) • Weather extreme impact is subdued by the reduction in VOCs & NOx emissions
Impacts of Weather Extremes on Daily PM2.5 under RCP8.5 (Future) Extreme event days (Future) Impact of extreme events (Present) Extreme event days (Present) Non-extreme days (Present) Impact of extreme events Heat wave only Stagnation only Compound event Impacts of extreme events (ug/m3) Daily PM2.5(ug/m3) • HW and St enhance PM2.5, with larger areas by HW but higher magnitude by St • CE yields larger effect (3-10 mgm-3 > sum of HW and St effects) • Weather extreme impact is subdued by the reduction in precursors/primary PM
Human Health Impact and Cost-Benefit Analysis(Extreme vs. non-Extreme, Future vs. Current)The Environmental Benefits Mapping and Analysis Program Community Edition (BenMAP-CE)
O3-related Mortality under RCP4.5 (Positive values mean additional deaths/costs; negative values mean avoided deaths/costs) CIE - Non_CIE CE - Non_CE St - Non_St HW - Non_HW Current Future • Mortalities induced by HW and CE occur mainly in CA and E. U.S. • Mortalities induced by St occur with higher rates over larger areas & dominate CIE • Avoided mortalities induced by HW and CE occur in FL and E. Texas and induced by St occur in FL, Pacific NW, CA and AZ, and several states in N.E. U.S. in future
O3-related National Annual Mortality (All Cause) and Associated Costs (Positive values mean additional deaths/costs; negative values mean avoided deaths/costs) • St contributes the most to CIE (84.7 vs 80.8%) as it occurs much more frequently than HW (8.8 vs 9.6%) and CE (6.7 vs 9.6%) under RCP4.5 and 8.5, respectively. • CIE in future w/o pop growth < CIE in current due to smallerΔO3 and less St, St dominates (67.7 vs 64.4%), followed by CE (16.7 vs 24.3%) and HW (15.6 vs 11.3%)) • CIE in future w. pop growth increases by 57% and 65% for RCP4.5 and 8.5
PM2.5-related Mortality under RCP4.5 (Positive values mean additional deaths/costs; negative values mean avoided deaths/costs) CIE - Non_CIE CE - Non_CE St - Non_St HW - Non_HW Current Future • PM2.5-related mortalities induced by HW, CE, and St are much higher than those by O3 • Unlike O3-related mortalities, additional mortalities occur over FL by HW/CE, and over FL and Pacific NW during St due to increased ΔPM2.5 in these regions
PM2.5-related National Annual Mortality (All Cause) and Associated Costs (Positive values mean additional deaths/costs; negative values mean avoided deaths/costs) • PM2.5-related mortalities and costs are much higher than those related to O3 • St contributes the most to CIE (92.7% vs 91.3%), followed by CE (4.4% vs. 5.3%) and HW (2.9 vs 3.4%) under RCP4.5 and 8.5, respectively. • CIE in future w/o pop growth < CIE in current due to smallerΔPM2.5 and less St, St dominates • (77.6 vs 65.6%), followed by CE (11.8 vs 18.5%) and HW (10.5 vs 15.9%)) • CIE in future w. pop growth increases by 69% and 71% for RCP4.5 and 8.5
O3 and PM2.5-related Morbidity under RCP4.5 Future CIE - Non_CIE (Positive values mean additional deaths/costs; negative values mean avoided deaths/costs) HD, All Respiratory • School Loss Days O3 885,266 days, $49M/yr 230 HD, $9M/yr • Work Loss Days HD, All Respiratory • HD, All Cardiovascular PM2.5 638,024 days, $113M/yr 949 HD, $37M/yr 422 HD, $20M/yr • O3-related respiratory HA increase in CA/E. U.S. and school loss days increase (53.4 days/yr) over most areas during CIE, St contributes the most, followed by CE and HW • PM2.5-related all respiratory HA > all cardio. HA, and high work loss days (38.5 days/yr)
PM2.5-related Mortality (Total 10 Counties) under RCP4.5 CE - Non_CE St - Non_St HW - Non_HW Future vs. Current Future/Current • Top 10 for HW: 3 in W. U.S., 5 in S.E., 1 in Midwest, and 1 in South plain. Future PM2.5-related mortalities increase by 2.4-43.4 in HW, with OF contributing the most, followed by changes in Pop and Y0. • Top 10 for St: 4 in W. U.S., 2 in N.E., 1 in Midwest, and 3in South. Future PM2.5-related mortalities increase slightly in 6 counties and decrease by 6.9-27.4% in 4 counties. In all 6 counties in TX and CA, the impact of increased Pop and Y0 dominates over that of reduced ΔC and over that of reduced OF in all counties except for Los Angeles. • Top 10 for CE: 6 in W. U.S., 2 in S.E., 1 in Midwest, and 1 in South. Future PM2.5-related mortalities increase by 1.6-16.8 in HW, with OF contributing the most, followed by changes in Pop and Y0. The changes in ΔC cause decreases in mortalities by 24.8-52.4%, which are compensated by the aforementioned increases.
O3 and PM2.5-related Mortality under RCP8.5 Future-Current CIE - Non_CIE (Positive values mean additional deaths/costs; negative values mean avoided deaths/costs) 2005 population 2050 population O3 -1,119 deaths, -$11.1B/yr -525 deaths, -$5.2B/yr PM2.5 -23,074 deaths, -$236.4M/yr -38,834 deaths, -$397.7M/yr • Large decreases in both O3- and PM2.5-related mortalities induced in future relative to current for CA and E. U.S. where the projected emission reductions are large. • The decreased O3- and PM2.5-related mortalities are anticipated to save 5.2-11.1 and 236.4-397.7 billion USD, respectively
Major Findings and Policy Implications • The O3- and PM2.5-related mortalities and morbidities caused by different types of weather extremes show strong spatial heterogeneities with much higher values over populated urban areas than less populated areas and strong urban to rural gradients. • Of the extreme events, the estimated O3– and PM2.5–related mortality and morbidity attributed to stagnation are the highest due to its much higher frequencies, followed by heat wave or compound extremes. • Large increases in heat wave and compound extremes events in the future decade dominate changes in mortality during these two extreme events whereas population growth dominates changes in mortality during stagnation that is projected to occur less frequently. • Projected reductions of anthropogenic emissions under both RCP scenarios compensate for the increased mortality due to future increased occurrence for heat wave and compound extremes. However, it is crucial to further reduce air pollutant emissions during weather extremes to minimize the adverse impacts of weather extremes on air quality and human health.