Asset Management
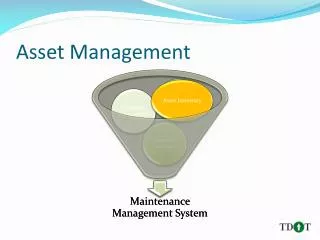
Asset Management. Asset Inventory. Inventory of assets maintained by the agency Critical for determining assets to be managed Foundation for building annual budget. Asset Inventory. GIS Map. Feature Extraction. Barrier Wall. Signs. Mowing Area. Rumble Strips. Pavement Markings.

Asset Management
E N D
Presentation Transcript
Asset Inventory • Inventory of assets maintained by the agency • Critical for determining assets to be managed • Foundation for building annual budget
Asset Inventory GIS Map Feature Extraction Barrier Wall Signs Mowing Area Rumble Strips Pavement Markings
Asset Inventory • Features extracted to database
Asset Inventory • Inventory imported to MMS • Budget distributed to counties based on inventory
Level of Service • Defines the amount of maintenance required to manage assets at a specified level • Should be supported at all levels of management within the agency • TDOT needs to tie Level of Service to the Condition Assessment to ensure that appropriate funding and resources are allocated to achieve target goals
Level of Service • Percent of assets maintained per year to achieve desired service level • Example: • Percent of signs replaced • Percent of pavement miles resurfaced • Frequency of performed maintenance on an asset • Example: • Number of mowing and litter cycles
Condition Assessment • How well are we maintaining our infrastructure? • Quantitative evaluation of the condition of assets • Should be analyzed and used to reallocate resources and funding to meet your asset management goals
Condition Assessment • TDOT uses a condition assessment program called the Maintenance Rating Index (MRI) • Random sample of roadway network • Approximately 6% of roadway miles evaluated each year • 7,107 1/10th mile segments assessed in FY 2010
Condition Assessment • Evaluates all roadway characteristics monthly • Each characteristic has weighting factor used to generate a score • Pass/Fail based on whether it meets the minimum condition standard • Score from 0 to 100 • Target score is 90
Condition Assessment • 10% of segments evaluated by third party consultant for quality assurance • In-house scores ~ 90 • QA scores ~ 82 • Red trend line should match up to black line if QA & In-house scores were similar • Red line shift indicates higher In-house scores • Concentration of points with In-House score of 100 & QA score considerably lower is a concern In-House vs. QA Score
Condition Assessment Strengths Weaknesses • Satisfies GASB 34 requirement • Quantitative evaluation instead of subjective opinion • Provides for opportunity to find deficiencies that windshield inspection may miss • Data indicates that In-House self-evaluation has lead to elevated scores • May need to consider using impartial third party to perform inspections in the future
Maintenance Management System • Implemented in July 2005 • Better Accountability • Ability to compare In-House Cost vs. Contract Cost • Provides documentation for: • Liability Claims • Federal Reimbursement • FEMA • FHWA – Emergency Relief • Approx. $8 Million for rockslides in 2009 & 2010 • Approx. $40 Million for May 1-2, 2010 flood
Future • Link Condition Assessment to Level of Service & Budget • Letter Grade Scale for Level of Service to simplify the communication of current condition and resource needs to achieve goals Source: North Carolina DOT, 2006 Report on the Condition of the State Highway System
Future • 3D mesh model of 13th Ave. @ I-40 in Downtown Nashville built from LiDAR data
Future • Street view
Future • 3D mesh with photolog overlay
Future • Fly through 3D model instead of driving through photolog
Future • Pan/Tilt/Zoom • View roadway assets from any angle
Future • Measurement tool allows for measurement of objects such as lane width, sign dimension, cut slope height, vertical/horizontal clearance, etc.