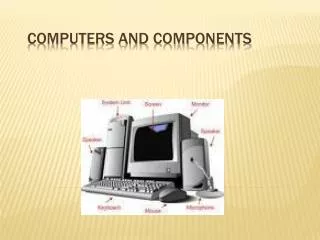
Computers and Statistics
AAH Help me!. Computers and Statistics. By Mai Fukata. TURTLE GRAPH. Shark Graph. Probability of Coral. The meaning of probability is… A way to measure the chances that something will occur in relation to the possible alternatives. Mangrove sea cigar seedlings.


Computers and Statistics
E N D
Presentation Transcript
AAH Help me! Computers and Statistics By Mai Fukata
Probability of Coral The meaning of probability is… A way to measure the chances that something will occur in relation to the possible alternatives
Mangrove sea cigar seedlings Below left: Mangrove sea cigar seedlings. Below right: Sea cigar, leaves, and the branch of a red mangrove tree.
Percent Composition by Mass of the flotsam(flotsam:floating things in the ocean, naturally from the sea, includes grass, leaves, etc)
Variance for "sea cigars" length data Meaning: Two values that are used in statistics to describe how far away your date from the mean • 6.7, 7.3, 7.5, 7.5, 9.4, 9.8, 11.2, 12.5, 13.1, 17.0(Measured in centimeters)
Chi test The Chi-square test can be used to see if there are any significant differences between date sites or sources
T-Test T-test: an equation you use designed to test whether there is a significant difference between the means of two independent samples. Question: Should the Fearless Fishers have rejected the null hypothesis? (Explain, using the T-statistic you generated and the table of critical values provided) Answer: Yes, the Fishers should have rejected the null hypothesis because their T-statistic value was calculated to be 3.75, which is greater than the critical value of 2.145 from the T-statistic table at 14 degrees of freedom and at the P-value of 0.05.