Download
1 / 61
610 likes | 860 Vues
Large-Eddy simulation of Pollutant Plume Dispersion over 2D Idealized Street Canyons. Department of Mechanical Engineering The University of Hong Kong. Colman C.C. Wong & Chun-Ho Liu. March 3, 2011. Outline. Introduction Methodology Results & Discussion

E N D
Large-Eddy simulation of Pollutant Plume Dispersion over 2D Idealized Street Canyons Department of Mechanical Engineering The University of Hong Kong Colman C.C. Wong & Chun-Ho Liu March 3, 2011
Outline • Introduction • Methodology • Results & Discussion • Pollutant transport below and around roof level • Pollutant dispersion in the urban boundary layer (UBL)
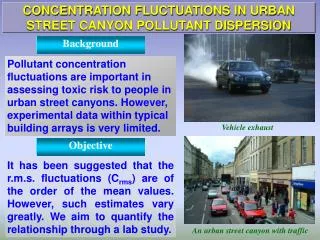
Introduction In a developed city like Hong Kong, the building-height-to-street-width ratio (aspect ratio, AR) is large. In case the wind is flowing perpendicular to the street canyon (worst case), the flow falls into skimming flow regime in which flesh air cannot entrain into the street canyons by mean flow. Source: Oke, T. R. "Street Design and Urban Canopy Layer Climate." Energy and Buildings, 11 (1988)
A satellite photo of MongKok, Hong Kong Any methods to remove/dilute the pollutants better? Source: Google map
Objectives The core objectives of this study are: • Develop a platform to calculate pollutant dispersion over idealized 2D street canyons using LES. • Examine how 2D urban roughness affects the flow structure and the pollutant dispersion in the urban boundary layer (UBL). • Elucidate the pollutant removal mechanism when the prevailing flow is perpendicular to the street canyons.
Introduction to CFD • Currently, three types of models are commonly used for resolving/modeling fluid turbulence. • k-ε model (RANS based) • Large-eddy simulation (LES) • Direct numerical simulation (DNS) • k-ε model Model LES DNS Accuracy Computational cost Relatively cheap Expensive Very expensive Lower Higher
The reason of using LES • Pollutant dispersion is strongly correlated with atmospheric turbulence • k-ε model assumes isotropic turbulent kinetic energy (TKE) but the turbulence structure over 2D roughness is highly anisotropic • Study of turbulence structure of individual components (i.e.: stream-wise fluctuation component) could not be achieved using k-ε turbulence model.
Methodology • Computational domain and boundary conditions AR=0.25 AR (Aspect ratio) = h/b AR=1.0
Model Details • CFD code used: OpenFOAM 1.7.0 • Turbulence model: Large-eddy simulation • With One-equation TKE subgrid-scale (SGS) model • Velocity-pressure coupling: PISO • Reynolds number: ~10,000 • Pollutant source: Constant concentration source
Results & Discussion Pollutant transport below & around roof level
Streamlines • Primary recirculation is formed within each street canyon. • The mean wind in the UBL do not go into the street canyons. AR = 1.0 AR = 0.25 Roof level
Cheng et al. (2008) pointed out that: In skimming flow regime, the pollutant removal is mainly governed by turbulent transport instead of the mean wind using RANS k-ε turbulence model.
Pollutant removal • The following slides show the vertical pollutant flux along the roof level. Here, the three types of flux are:
Mean flux vs turbulent flux across roof level (ar=1) Pollutant removal is dominated by turbulent flux Vertical Pollutant Flux Pollutant transport is dominated by mean flux x/h
Question How is the pollutant removed from the street canyons to the UBL?
Skewness of u (AR=1) Some air masses accelerate while Most of the air masses decelerate
Snap shot of iso-surfaces of streamwise fluctuation velocity at roof level • Large amount of decelerating, up-rising air masses are located along the roof level. u" < 0 represents deceleration w”≈w at roof level
coherent structure at roof level • " < 0 occurs in the street canyons without pollutant source.
Removal mechanism The accelerating air masses (u˝ > 0) carry the background pollutant into the street canyon by sweeps. The decelerating air masses (u˝ < 0) remove the ground-level pollutant to the UBL by ejections. The primary re-circulation mixes the pollutant within the street canyon.
Removal mechanism With pollutant sources >> Pollutant removal by ejections Pollutant entrainment by sweeps ≈ Without pollutant source
Question Where does the turbulence come from?
Mean flow velocity (AR=1) The production term of TKE Maximum gradient
Resolved-scale TKE (AR=1) Maximum TKE
RS-TKE contours Maximum TKE Local turbulence production is not the major source of roof-level TKE for pollutant removal. AR=1 AR=0.25 Maximum shear
Cui et al. (2004) found that sweeps (u">0, w"<0) dominate the total momentum flux at roof level using LES with street canyon of AR=1. • Christen et al. (2007, pp.1962) figured out that under neutral stratification, sweeps dominate the exchange of vertical momentum at z ≤ 2.5h, employing quadrant analysis on the data measured from street canyons in Basel, Switzerland.
Section summary • The re-circulating flows carry the pollutant to the roof level and also mix/dilute the pollutant within the street canyon. • The aged air (carrying pollutant) is removed by ejections while fresh air is entrained by sweeps. • The TKE required for pollutant removal is mainly attributed to the (downward moving) atmospheric turbulence in the UBL.
Results & Discussion Pollutant dispersion in the UBL
Necessary domain size • In the LES of open-channel flows over a flat, smooth surface, the domain-length-to-domain-height ratio is often greater than 4π in order to resolve the turbulence correctly. (e.g. Enstadet al. 2006) • Its computational cost is too high, if roughness are explicitly resolved.
Two-point Correlation • Two-point correlations are commonly used to determine the necessary (minimum) domain size for resolving the turbulence. Ideally, the correlation of flow velocity drops to zero at certain horizontal separation, which is then used to determine the length scale of turbulence. • where
Two-point correlation (Ar =1) The autocorrelation reaches 0 at any elevations.
Streamlines • The streamlines in the UBL are almost parallel to the streamwise direction. AR = 1.0 AR = 0.25 Roof level
Pollutant plume AR = 0.25 AR = 1
Plume profiles • Gaussian pollutant plume model has been widely used in the last 5 decades. • It was originally designed for rural areas (open terrain). • The re-circulating flows below the UBL are not considered • Davidson et al. (1996), using wind tunnel experiments, showed that the pollutant plume over an obstacle array exhibits a Gaussian form.
Vertical Plume Obvious difference between AR=1 and AR = 0.25
Section summary • The current computational domain is large enough handling the atmospheric turbulence in the UBL over idealized 2D urban roughness. • The street canyons of AR = 0.25 would have better air quality compared with AR = 1 counterparts. • The vertical plume profiles are functions of ARs.
Acknowledgment • This study was jointly supported by the Strategic Research Areas and Themes, Computational Sciences, and the University Research Committee Seed Funding Programme of Basic Research 200910159028 of the University of Hong Kong. The computation is supported in part by a Hong Kong UGC Special Equipment Grant (SEG HKU09). The technical support from Lillian Y.L. Chan, Frankie F.T. Cheung, and W.K. Kwan with HKUCC is appreciated.
References Ashrafian A, Andersson H, Manhart M. 2004. DNS of turbulent flow in rod-roughened channel. Int. J. Heat and Fluid Flow 25: 373–383. Bady M, Kato S, Huang H. 2008. Towards the application of indoor ventilation efficiency indices to evaluate the air quality of urban areas. Build. Environ. 43: 1991–2004. Bentham T, Britter R. 2003. Spatially averaged flow within obstacle arrays. Atmos. Environ. 37: 2037–2043. Barlow JF, Belcher SE. 2002. A wind tunnel model for quantifying fluxes in the urban boundary layer. Boundary-Layer Meteorol. 104:131–150. Coceal O, Dobre A, Thomas TG, Belcher SE. 2007. Structure of turbulence flow over regular arrys of cubical roughness. J. Fluid Mech. 589:375-409. Cheng WC, Liu CH, Leung DYC. 2008. Computational formulation for the evaluation of street canyon ventilation and pollutant removal performance. Atmoshperic Environment. 42:9041-9051 Cheng WC, Liu CH. 2010. Large-eddy simulation of flow and pollutant transport in and above two-dimensional idealized street canyons. Manuscript submitted to Boundary-Layer Meteorol.
References Cui ZQ, Cai XM, Baker CJ. 2004. Large-eddy simulation of turbulent flow in a street canyon. Quarterly Journal of the Royal Meteorological Society 130: 1373–1394. Davidson MJ, Snyder WH, Lawson RE, Hunt JCR. 1996. Wind tunnel simulations of plume dispersion through groups of obstacle, Atmospheric Environment.30: 3715-3731. Liu CH, Leung DYC, Barth MC. 2005. On the prediction of air and pollutant exchange rates in street canyons of different aspect ratio using large-eddy simulation. Atmos. Environ. 39: 1567–1574. Macdonald RW, Griffiths RF, Hall DJ. 1998. A comparison of results from scaled field and wind tunnel modeling of dispersion in arrays of obstacles. Atmospheric Environment. 32: 3845-3862. Michioka T, Sato A, Takimoto H, Kanda M, 2010. Large-Eddy Simulation for the Mechanism of Pollutant Removal from a Two-Dimensional Street Canyon. Boundary-Layer Meteorol.DOI 10.1007/s10546-010-9556-2 OpenFOAM. 2011. OpenFOAM: The open source CFD toolbox. Http://www.openfoam.com/. Smagorinsky J. 1963. General circulation experiments with the primative equations I: The basic experiment. Month. Weath. Rev. 91: 99–165.
Results & Discussions Model validation
Flow structure within canyon • The vertical profiles of the following parameters on the vertical plane of the model with AR =1 were investigated: • Mean flow velocity, u and w • Turbulence Kinetic Energy, TKE • Skewness of u and w • Kurtosis of u and w • The results are compared with LES model by Cheng 2010 (represented by squares), Cui et al. 2004 (represented by triangles) & wind tunnel experiment by Brown 2000 (represented by circles).
Mean flow velocity, U Max gradient