Download

1 / 15
150 likes | 290 Vues
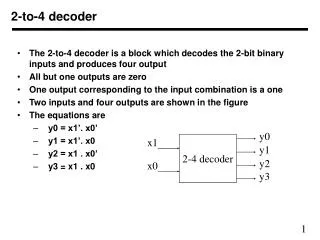
International Comparisons of Industry Output, Inputs and Productivity Levels: Methodology and New Results. Presentation prepared for Discussion session on Productivity Levels and PPPs, Bern, 18 October 2006 Marcel Timmer, Groningen Growth of Development Centre, University of Groningen

E N D
International Comparisons of Industry Output, Inputs and Productivity Levels:Methodology and New Results Presentation prepared for Discussion session on Productivity Levels and PPPs, Bern, 18 October 2006 Marcel Timmer, Groningen Growth of Development Centre, University of Groningen This project is funded by the European Commission, Research Directorate General as part of the 6th Framework Programme, Priority 8, "Policy Support and Anticipating Scientific and Technological Needs".
Motivation • Recent changes in global structures of production and trade • To what extent do countries differ in their production structure in terms of: • ICT capital intensity • Skilled labour usage • Materials and Energy usage • Services inputs • Productivity levels? • This paper provides new evidence on relative levels of output, inputs and productivity at a detailed industry level • For 1997 for Australia, Canada, France, Germany, the Netherlands, the UK and the US.
Methodology • Basically: deflation of Input-Output tables using relative prices of inputs and output across countries • Multilateral index number approach advocated by Caves, Christensen and Diewert (CCD, 1982), following Conrad and Jorgenson (1985), • PPPs following Nishimizu and Jorgenson (1978); Jorgenson, Kuroda and Nishimizu (1987) • Two new characteristics in this paper • Sectoral measures of output, input and productivity (Gollop, 1979) to eliminate effect of differences in industry structure • Relative prices based on producer, rather than expenditure prices
Table 1 Comparison of input shares in output, with and without integration, transport equipment manufacturing, 1997
Variables for level accounting • Supply-Use tables for all seven countries in 1997 • SUTs turned into symmetric Input-output table (industry by industry) at basic prices plus net taxes, using fixed product-sales structure assumption, • Split of SIOT into domestic table and import • 26 industries covering total economy • 45 intermediate products (aggregated to materials, energy and service inputs) • Six capital assets (including ICT and non-ICT capital) • Two Labour categories into university & non-university labour • PPPs for sectoral output, sectoral intermediates, capital and labour for 1997
Output and input PPPs • Output PPP: A mix of production PPPs and adjusted expenditure PPPs for industry (gross) output, basic prices (Timmer, van Ark & Ypma, 2006) • Intermediate input PPPs: assume same basic price for all deliveries from industry j (domestic table) and exchange rates for import table • Labour PPPs: relative wages of university & non-university labour • Capital PPPs: investment PPPs for 6 assets combined with annualization factor (relative user cost of capital)
Table 2 Relative price levels of sectoral output and inputs, transport equipment manufacturing (PPPs / exchange rate, US$=1), 1997
Methodology for level accounting Using the CCD approach translog multilateral indices of output relative to the U.S. can be derived as follows:
Figure 1, Relative TFP levels by industry group in the Netherlands, France, Germany, UK, Canada and Australia in 1997, U.S.=1 Unweighted industry average TFP levels, 1997, US=1.0
U.S. most ICT intensive; non-ICT capital intensity in Europe still larger Unweighted industry average capital input per unit of output, 1997, US=1.0 Source: pre-EU KLEMS data, GGDC
European countries least energy and services-intensive but more materials-intensive Unweighted industry average intermediate input use per unit of output, 1997, US=1.0 Source: pre-EU KLEMS data, GGDC
Main findings • European TFP levels on par with U.S., but lower in Canada and Australia • U.S. production is more intensive per unit of output in use of • ICT capital, • Skilled labour, • Energy, • Purchased services, • But less intensive in • Materials • non-ICT capital
Next steps • Full KLEMS data set for EU (see www.euklems.com) • Are differences in productivity growth and levels in services real or figments of measurement error? • Adequate treatment of net taxes in IO-framework • Aggregation to total economy • Evaluate index number alternatives for output and productivity level comparisons