cience
S. O. S. S. S. O. ?. or. cience. cience. chools. n. n. chools. After 50 years policy makers are still saying SOS . An exploration into the effects of science and on science in Arkansas middles schools. By Charlie M. Belin. Three Crises of Science Education Debate

cience
E N D
Presentation Transcript
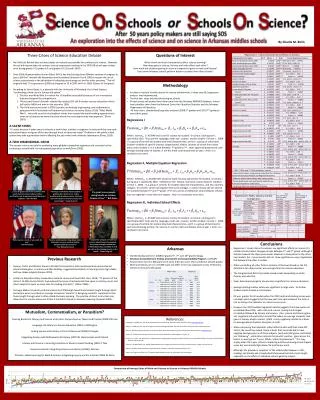
S O S S S O ? or cience cience chools n n chools After 50 years policy makers are still saying SOS An exploration into the effects of science and on science in Arkansas middles schools By Charlie M. Belin • Three Crises of Science Education Debate • No Child Left Behind does not hold states and schools accountable for proficiency in science. However, the act did require states to conduct science assessments starting in the 2007-08 school year at least once during grades 3-5, grades 6-9, and grades 10-12 (Leath 2007). • Since 2006, Representative Vernon Ehlers (MI-3) has tried during three different sessions of congress to pass a bill that “amends the Elementary and Secondary Education Act of 1965 to require the use of science assessments in the calculation of adequate yearly progress, and for other purposes.” The bill originally had 17 cosponsors in 2006 but dropped to 10 in 2007 and 4 in 2009. (Library of Congress). • According to James Gates, Jr, a physicist with the University of Maryland, the United States is “confronting a third crisis in Science Education.” • 1. The first was World War II in which the US handled successfully because of our innovations • that went beyond the competition’s. • 2. The second, Russia’s Sputnik, created the loudest SOS call for better science education, which • did lead to NASA and men on the moon by 1969. • 3. The third and current crisis is STEM (science, technology, engineering, and mathematics) • education which he believes will determine the future economy (Gates 2010). “After World • War II… we could count on the brightest minds from around the world seeking opportunity to • come to us because we were the place where the most opportunity was apparent." (Dove • 2010). • A SILENT CRISIS • “It's quiet because it takes years to educate a world-class scientist or engineer. It starts with the very early educational years and goes all the way through levels of advanced study.” Problems in the public school system may take a generation before affecting the job market and university laboratories (Dove, 2010). • A TWO DIMENSIONAL CRISIS • The current crisis is not only for producing more globally competitive engineers and scientists but for producing a scientifically literate general population as well(Gross 2009). • Questions of Interest • What school and local characteristics affect science learning? • How does gains in science, literacy, and math affect each other? • How much are students gaining in science compared to gains in math and literacy? • Does some Arkansas schools perform better in science than other schools? • Methodology • In order to capture a better picture of science achievement, a three step OLS regression analysis was implemented. • The first two steps included clustering by schools. • All test scores and student level data came from the Arkansas NORMES database. School level variables were from the National Center for Education Statistics and the Arkansas Department of Education. • All tests were standardized by grades and year (2008 5th graders and 2010 7th graders) – one cohort group • Regressions I • scienceist = 0 + 1Testsit-2 + 2Jist+ 3Dst+ + 4Kist+ εist • Where scienceistis ACTAAP test score for science for student i in school s during year t, specifically 2010. Tests are the language, math and , science test for student i in time t , 2008. J is a group of controls for student observed characteristics, and D is a group of school and location variables of specific interest: congressional district, location of school from urban areas, years student is in a school between 5th grade to 7th, voter approved property tax, and average starting salary of teacher. K are the math and literacy tests at year t. And ε is a stochastic error term. • Regression II, Multiple Equation Regression • Testsist = 0 + 15thTestsist-2 + 2Jist+ 3Hst+Hst*Hst +εist • Where 7thTestsistis ACTAAP test scores for math, literacy and science for student i in school s during year t, specifically 2010. 5thTestsare the literacy, math and, science tests for student i in time t , 2008. Jis a group of controls for student observed characteristics, and His a dummy category for schools which had negative test score averages in math, literacy and /or science for students between 5th and 7th grade. H*H are a series of interaction terms between schools that are negative in more than one subject . And ε is a stochastic error term. • Regression III, Individual School Effects • scienceist = 0 + 1Testsit-2 + 2Jist + 3Fst+ + 4 Kist + εist • Where scienceistis ACTAAP test score for science for student i in school s during year t, specifically 2010. Tests are the language, math and , science test for student i in time t , 2008. J is a group of controls for student observed characteristics, and Fis a group of dummies for each school testing at time t for science. K are the math and literacy tests at year t. And ε is a stochastic error term. "Having a scientifically literate public is going to be critical as our nation wrestles with problems whose solutions seem inherently to involve science and technology.” ~James Gates Jr. "...a very large percent of our teachers who teach math and science have neither certification nor a degree to teach those two subjects.“~ Bart Gordon It's great to see people doing hands-on science. Science is fun.“ ~ Bill Gates "I regard the collapse of math and science education as the greatest long-term strategic problem the United States has, and likely to end our role as the leading country in the world.” ~Newt Gingrich "Either you're a nerd, or you work for one.” ~Vernon Ehlers “Science and education have been vital to America's success, and they will be indispensable to our future.” ~Kay Bailey Hutchison • Conclusions • Regression I model did not conclude any significant effects on science if a middle school student changes schools between 5th and 7th grade, although it did lean towards the three year model. However in comparison to the other two models, the 3 years model did not show significance using a hypothesis test between the other 2 models. • When controlling all other factors, location of the town based on the IES definitions for urban-centric was not significant on science education. • The Congressional district provided mixed results depending on which dummy was selected. • Voter determined property tax was also insignificant on science education. • Average starting teacher salary was significant in large units. So further studies should include a cost analysis. • R2 was greater for all models when the 2010 math and reading scores were included, which suggests that the two year time span between the tests is not as strong of an indicator as a more current year. • However the 2010 multiple regression results suggests the three exams are correlated about 30%, with math and science having the strongest correlation followed by literacy and science. Also science and literacy gains are negatively influenced by a school that where on average students lose gains in literacy and/or science. Math is only negatively related to schools on average where students lose gains in math . • When comparing the individual school effect results with their state AYP status, the results are mixed. Some schools that are predicted to have negative average gains in all three subjects (with everything else controlled) are “Achieving” , while other schools that predict positive gains across the board on average are “5 year Whole School Improvement .” This may simply mean the 5 year school is improving and the achieving school slipped some but was already high above the proficiency mark. • Although this provides a snapshot of the relationship between math, reading, and literacy yet a longitudinal study would provide more insight, especially on the effect of individual schools gains by subject. • Arkansas • Started testing science in 2008 for grades 5th, 7th, and 10th grade biology. • Arkansas Comprehensive Testing, Assessment and Accountability Program (ACTAAP) • Science tests are on 0-500 scale score and a 0-80 raw score. 250 is proficient at both grades. • Math and literacy are on a 0-1000 scale and differ in the raw scale base scores. Proficiency minimum increases with grade. • Previous Research • Greene, Trivitt, and Winters found in Florida that students in both sanctioned and nonsanctioned schools made gains in science and their findings suggested correlations in learning across high stakes and low stakes subjects (Greene 2010). • Center on Education Policy conducted a national survey and found that since NCLB, “71 percent of the nation's 15,000 school districts had reduced the hours of instructional time spent on history, music and other subjects to open up more time for reading and math,” (Dillon 2006). • Carnegie Mellon University and the University of Pittsburgh found that students taught through direct instruction were more likely on average to become “experts” in designing scientific experiments than those taught through what is often called discovery learning. The practice of direct instruction may allow time for science class even if time is limited for hands on discovery learning (Cavanah 2004). • Mutualism, Commensalism, or Parasitism? • Crossing Borders in Literacy and Science Instruction: Perspectives on Theory and Practice (2004)EW Saul • Language and Literacy in Science Education (2001) JJ Wellington • Linking Science and Literacy in the K-8 Classroom (2006) R Douglas • Integrating Science with Mathematics & Literacy(2007) EL Hammermanand D Musial • Literacy and Science: a Learning Limitation or Route to Good Teaching (2002) T Tate • Science Essentials: Integrating Science and Literacy (2006) L Brenner • Problem –Based Learning for Math & Science: Integrating Inquiry and the Internet (2006) DL Ronis References Cavanagh, S. (2006, Nov. 10). NCLB Could Alter Science Teaching. Education Next. Retrieved from www.edweek.org Dillon, S. (2006). Schools Cut Back Subjects to Push Reading and Math. The New York Times. Retrieved from ww.nytimes.com. Dove, A. (2010). Science Education Crisis Intervention. New York Academy of Science Movement. Retrieved from www.nyas.org Gates, J.S. (2010) Confronting a third crisis in US Science Education. Science News, 177(11), 32. Greene, J.P, Trivitt, J. & Winters, M.A. (2010) Impact of High Stakes Testing on Student Proficiency in Low Stakes Subject. Economics of Education Review, 29(1) 138-146. Gross, K.L. & Mittelback, K.G. (2009). What Maintains the Integrity of Science: An Essay for Nonscientists. Emory Law Journal, 58. Leath. A. (2007). Student Performance Assessment in Science. American Institute of Physics, 74. Library of Congress. Bill Text 111th Congress (2009-2010) H.R.2511 .II. Retrieved from Thomas.gov