Download
1 / 21
210 likes | 550 Vues
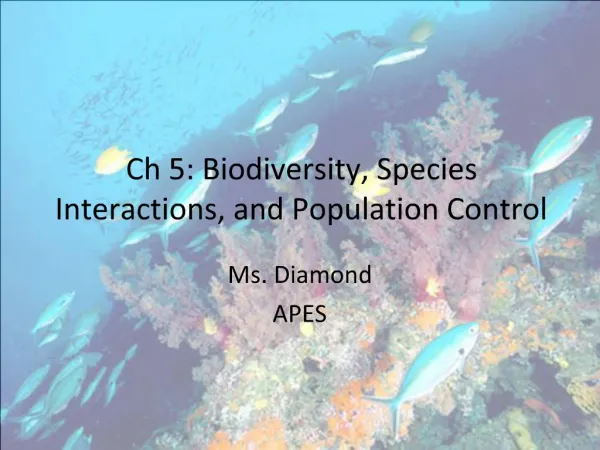
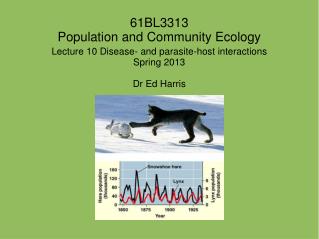
Complex interactions and population control in nature: Lecture Content. We’ll talk about three issues relevant to population control in nature, issues that expand our understanding of the complexity of ecological systems beyond what we’ve discussed so far…

E N D
Complex interactions and population control in nature: Lecture Content • We’ll talk about three issues relevant to population control in nature, issues that expand our understanding of the complexity of ecological systems beyond what we’ve discussed so far… • What factor(s) have the greatest impact controlling populations? • What are “metapopulations”, and how does a population’s spatial distribution influence its stability and control? • What is the relative impact of “top down” versus “bottom-up” (trophic-dynamic) control of populations?
What factor(s) control or influence population size in nature? • Suppose you were studying the population of Nephila spiders in LaFitte National Historical Park • Method: circular quadrats, as in lab (control for habitat, season) • Density per quadrat dropped from 5 in 2001 to 0.5 in 2002 • What factors would you need to investigate as possible explanations for the population stability or dynamics in this species? • Population interactions • Spatial impacts • Weather • How would you distinguish the most important factor(s)?
Key-factor analysis • Define key-factor analysis = method to identify which mortality factor has greatest impact shifting population away from equilibrium (i.e., limiting population) • Identifies relative strengths of all mortality factors (ki) • k-values = “killing power”, defined as log(Nt) -log(Nt+1), where Nt = population size at time t, before mortality factor i acts; Nt+1 = population at time t+1, after it acts • Ki’s are mortality factor (like qx); their value is that they are additive, allow partition of mortality into components • Method of analysis • k-values measured for a number of years; graphed • Key factor is the k-value that most closely mirrors overall mortality, K • Regression of ki’s against total annual mortality, K
Example of key-factor analysis • Data from classic study by Varley, Gradwell, and colleagues on oak winter moth • Methods • A number of cohorts followed in field over 13 years • Number of insects lost to variety of mortality factors quantified using several methods (see text) • k-values calculated as described • Results • Loss of larvae over winter (k1) was largest k-factor, mirroring K; and also in regressions showed greatest (statistically significant) slope when plotted against K • See example calculations of k-factors for one year (next slide)
Oak winter moth data for one year (from Varley, Gradwell, & colleagues; see Stiling Table 13.1)
Density-dependence of mortality factors (k-values) is next step in analysis, after identification of key factor(s) • Density dependence identifies those mortality factors that could regulate population, i.e., return population size to some constant value (carrying capacity) • In oak winter moth example, only two factors were regulatory (see overhead, Fig. 13.6, Stiling text) • Pupal predation (k5) was positively density-dependent (mortality increases with density, log(N), i.e. regulatory • Other larval parasites (k3) was inversely density-dependent, and thus potentially destabilizing to population growth(less mortality with increasing population is a positive feedback on population size!)
Surveys of different organisms in nature reveals few generalizations • Key factors in diverse populations? • Some examples • Sand dune annual plant--seed mortality in soil • Colorado potato beetle--adult emigration • Tawny owl--reduction in egg clutch size from max. size • Gradd-mirid insect--no obvious key factor identified • Few generalizations have emerged overall • Density-dependence? (see Fig. 13.7,Stiling) • Insects disproportionately regulated by parasites, diseases, predators • Small birds and mammals by limited space, crowding • Large mammals by mortality associated with limited food
Spatial distribution of populations is another, new aspect of complexity that can stabilize or de-stabilize abundance • Metapopulation • Defined: group of isolated, interconnected populations • Each sub-population may or may not act as an independent population • Potential to stabilize total population (colonization rate > extinction rate) • Classification of metapopulations (diagram, next slide) • Classic metapopulation (rare; Richard Levins, 1969) • Core-satellite metapopulation (common) • Patchy population (common) • Nonequilibrium metapopulation (rare) • Source-sink populations (common; Ron Pulliam et al.)
Classification of metapopulations Core-satellite metapopulation Classic metapopulation l > 1 l < 1 l < 1 l < 1 Nonequilibrium metapopulation l > 1 Source-sink populations Patchy population
Classic metapopulation can stabilize population • Mechanism of stability? • Dp/dt = mp(1-p) - xp, where p = number of occupied patches, m = rate of movement between patches, x = extinction rate of occupied patches • At equilibrium, Dp/dt = 0 ==> p = 1- (x/m) • Equilibrium reached if x < m • Examples? • Few examples of classic metapopulation have been described • Best known is population of Bay ckeckerspot butterfly (Euphydryas editha) studied on Jasper Ridge,California, and other areas • Its food plant found on serpentine soils (hi in Mg, Fe) • Both extinction & re-colonization documented
Spotted owl population--example of classic metapopulation? This is an endangered species,occupying patches of old-growth coniferous forest in W. U.S.; little is known about patch-patch dispersal
Trophic structure adds a third set of complex interactions among species • Trophic structure of ecosystems is concept formalized by Lindeman: trophic-dynamics • Flow of nutrients, energy in food chain from ultimate source (sun, or center of Earth)-->plants (1º producers) -->herbivores (1º consumers)-->2º consumers-->3º consumers-->detritivores • Such trophic structure adds complexity:multiple controls • “Bottom-up” control of populations is hypothesis (put forth by Lindeman) that all populations are controlled by entities lower in food chain • E.g., plants controlled by energy in sunlight (& nutrients, water, of course) • Top predators ultimately controlled by total energy in food chain
Trophodynamics, continued • “Top-down” control involves higher entities in food chain (or web) as control agents--e.g., predators, herbivores • Hairston, Smith, & Slobodkin (HSS) ideas, already discussed, involve top-down control • Marquis & Whelan study of birds eating caterpillars on white oak saplings (again, already discussed) • Another example: Kelp-->sea urchins-->sea otters • Pelagic marine food webs, often four trophic levels, also illustrate top-down forces: top predators (piscivores) reduce abundance of zooplankton feeders, which releases pressure on zooplankton, which become abundant enough to crop phytoplankton (oceans not “green”, unlike terrestrial ecosystems--see next slide)
Diagramatic illustration of bottom-up & top-down trophic control
Top-down control allows for possibility of indirect trophic effects Carnivore - + Indirect effect of carnivore on plant via control of herbivore Herbivore + - + Plant
Bottom-up control of zooplankton abundance: more algae-->more zooplankton feeding on the algae (from Ricklefs 2001) 0.1 1 10 100 1000 Chlorophyll (mg per L)
Top-down control of zooplankton: addition of fish (predators) leads to decrease zooplankton, increase algae
Synthesis of bottom-up & top-down forces? • One scheme is Ecosystem Exploitation Hypothesis (EEH)--Oksanen, Fretwell, and others • Biomass at a given trophic level depends on how many trophic levels present (both bottom-up & top-down forces--see Fig. 13.12 Stiling text) • The number of trophic levels present depends on total ecosystem (environmental) productivity • Foregoing slides illustrate importance of both bottom-up & top-down forces in freshwater zooplankton-fish communities, supporting these ideas • Algae in aquatic & marine food chains tend to be relatively edible (no woody support tissue, as in trees!), allowing more biomass, and longer food chains
Conclusions: • Multiple factors control populations of most, if not all organisms, necessitating methods (like key-factor analysis) to assess relative strengths of control • Key factors identify factors that perturb populations, density-dependence identifies those that regulate • Metapopulations add spatial-temporal complexity to population dynamics, and come in a variety of flavors, some of which can help stabilize population (e.g., satellite-core, source-sink, classic metapopulation) • Trophic-dynamics adds complexity in terms of multiple possible controls (bottom-up, top-down), and indirect interactions (e.g., predators help plants by controlling herbivores)
Acknowledgements: Some illustrations for this lecture from R.E. Ricklefs. 2001. The Economy of Nature, 5th Edition. W.H. Freeman and Company, New York.