Download
1 / 26
260 likes | 390 Vues
User-Focused Verification. Barbara Brown* NCAR July 2006. bgb@ucar.edu. Concepts of user-focused verification Barbara Brown, NCAR; bgb@ucar.edu. Purposes of verification* Administrative Scientific Economic *Brier and Allen, 1951. Concepts of user-focused verification.

E N D
User-Focused Verification Barbara Brown* NCAR July 2006 bgb@ucar.edu
Concepts of user-focused verificationBarbara Brown, NCAR; bgb@ucar.edu Purposes of verification* • Administrative • Scientific • Economic *Brier and Allen, 1951 July 2006
Concepts of user-focused verification Purposes of verification (Brier and Allen, 1951) • Administrative • Scientific • Economic Postulate: • Most verification, to date, serves only the first purpose (administrative) • This is especially true for verification of operational systems July 2006
Historical perspectiveThe Finley example Lebanon, KS, 1902 John Park Finley 1854-1943 (from Galway, 1985; BAMS) • U.S. Army (Signal Service/Corps) 1877-~1920 • Tornado predictions 1884-1885 • Two 8-h outlooks per day • Spotter reports (~1,000 reporters) • 18 districts, eastern U.S.; 4 parts in each July 2006
The Finley example • Finley forecasts • 96.6% accurate • “Accuracy” if no tornado forecasts issued: 98.2% July 2006
The Finley example: Outcomes • The first (?) scientific discussion of verification • Numerous verification measures developed (e.g., Equitable Threat Score, Heidke skill score) • Many issues raised • Definition of forecast “event” • Quality of observations • Baselines of no skill • “Dimensionality” of the verification problem • Specifying purpose of verification • Use and value of forecasts • Asymmetric costs of misclassification Source: Murphy, 1996 (WAF, 11, 3-20) July 2006
Current situation Not much has changed… • Measures-based approaches applied in practice • Operational verification focuses on “management” needs and model-centric applications of verification • i.e., not on diagnostic or user-focused approaches • Focus is on • A few traditional measures • Aggregated statistics • A few parameters (e.g., 500 mb ht, T, PoP) July 2006
Current situation cont. • Model verification “drives” choices in model parameterizations, development, etc. • Ex: verification of models using RMSE or anomaly correlation applied to 500 mb heights leads to particular choices in model development and evolution (which may – or may not – be intended) • Uncertainty in verification measures is rarely estimated • Forecast use/value rarely considered July 2006
Uncertainty in verification measures Model precipitation example: Equitable Threat Score (ETS) Confidence intervals take into account various sources of error, including sampling and observational Computation of confidence intervals for verification stats is not always straight-forward July 2006
Forecast Evaluation: Quality vs. Value Forecast VALUE (User studies; Impacts) Forecast QUALITY (Verification) Forecast EVALUATION July 2006
What’s wrong with the traditional, measures-oriented approach? Traditional verification measures (e.g., RMSE, CSI, ETS) • Provide overall monitoring of forecast performance But • Measure only limited attributes of forecast quality • Tend to reward “smooth” forecasts • Do not provide information about what went wrong with a forecast (they only say that it was wrong) • Cannot diagnose how the forecast can be “fixed” or feed into forecast development process • Are not “informative” to users July 2006
Challenges and issues: Traditional verification approaches First four forecasts have POD=0; FAR=1; CSI=0 i.e., all are equally “BAD” Fifth forecast has POD>0, FAR<1, CSI>1 Traditional verification approach identifies “worst” forecast as the “best” O F O F F O F O O F July 2006
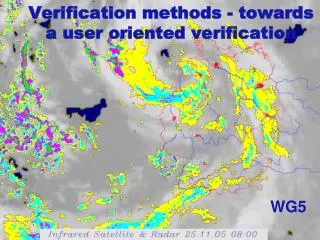
High vs. low resolution Which rain forecast would you rather use? Mesoscale model (5 km) 21 Mar 2004 Global model (100 km) 21 Mar 2004 Observed 24h rain Sydney Sydney RMS=13.0 RMS=4.6 From E. Ebert “Smooth” forecasts generally “Win” according to traditional verification approaches. July 2006
Why do users need verification information? • Improve forecasts • Determine whether to use a forecast or forecasting system • Heeding/ignoring warnings Interpretation of forecast (“What does a forecast of 32 really mean?”) • Input to decisions and/or decision-support systems • Economic and forecast value implications July 2006
User-focused verification: Good forecast or Bad forecast? F O July 2006
User-focused verification: Good forecast or Bad forecast? F O If I’m a water manager for this watershed, it’s a pretty bad forecast… July 2006
User-focused verification: Good forecast or Bad forecast? F O A B Flight Route O If I’m an aviation traffic strategic planner… It might be a pretty good forecast Different users have different ideas about what makes a good forecast July 2006
An initial goal: Diagnostic evaluation approaches • Identify and evaluate meaningful attributes of the forecasts • Example questions: What is the typical location error? Size error? Intensity error? • Provide detailed information about forecast quality • What went wrong? What went right? • How can the forecast be improved? • How do 2 forecasts differ from each other, and in what ways is one better than the other? July 2006
Examples of alternative (more user-focused) diagnostic approaches (spatial forecasts) • Scale-separation approaches • How does performance change as the resolution changes? • Entity-based verification • What are the major contributors to forecast error? • “Fuzzy” approaches • Take into account observational error, impacts of displacement errors • Composite approach • Evaluate systematic errors • Object-based verification • Examine forecasts’ ability to reproduce certain attributes (e.g., location, shape, intensity) July 2006
Object-based verification example Locations: Forecast objects are Too far North (except B) Too far West (except C) Precipitation intensity: Median intensity is too large Extreme (0.90th) intensity is too small Size: Forecasts C and D are too small Forecast B is somewhat too large Matching: Two small observed objects were not matched Df Do Cf Co Bf Af Bo Ao Forecast Observed POD = 0.27 FAR = 0.75 CSI = 0.34 July 2006
Composite verification example Average rain (mm) given an event was predicted Average rain (mm) given an event was observed FCST-shade OBS-contour FCST-shade OBS-contour From J. Nachamkin July 2006 Accepted for public release: 7530-03-70
A new paradigm for verification: Levels of User-focus • Level 0 • Measures-oriented aggregated summaries of performance • 1 or 2 traditional statistics (e.g., RMSE, CSI) • Uncertainty in verification measures not considered • Uses: Administrative July 2006
A new paradigm for verification: Levels of User-focus • Level 1 • Broad diagnostic approaches applied • A more complete view of forecast performance • Distributions of errors presented for meaningful subsets (temporal, spatial) • Stratified into relevant categories • Some uncertainty estimates • Uses/Users: Admin, Forecast developers, some users July 2006
A new paradigm for verification: Levels of User-focus Df Do Cf Co Bf Af Bo Ao • Level 2 • Features-based verification applied • Detailed information about forecast attributes • Attribute information can be tailored to meet specific types of information needs • Results stratified into relevant categories • Uncertainty information provided • Uses/Users: Admin, Forecast developers, Broad range of users July 2006
A new paradigm for verification: Levels of User-focus • Level 3 • Users identify the type of forecast “quality” or “performance” information that is needed for particular decisions, or as input to a decision support system • Verification is tailored to meet the needs of specific users • Level 4 • Economic or cost-loss models or survey methods are used to assess the value or benefits of particular forecasts for specific users and applications July 2006
To summarize… • What makes a good forecast depends on the user and the decision to be made • Corollary: Different users need different types of verification information • Forecast verification measures are uncertain, and that uncertainty should be estimated and communicated • Approaches are available (or could be developed) that more appropriately represent potential forecast value and would be useful for the process of estimating value July 2006