
Global Scale Winds
E N D
Presentation Transcript
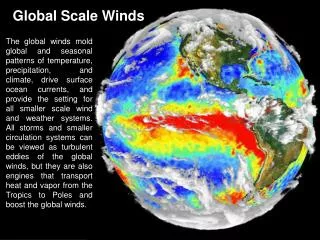
Global Scale Winds The global winds mold global and seasonal patterns of temperature, precipitation, and climate, drive surface ocean currents, and provide the setting for all smaller scale wind and weather systems. All storms and smaller circulation systems can be viewed as turbulent eddies of the global winds, but they are also engines that transport heat and vapor from the Tropics to Poles and boost the global winds.
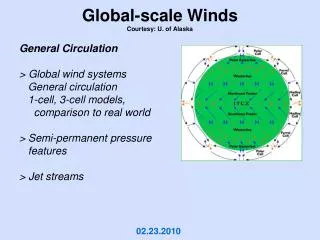
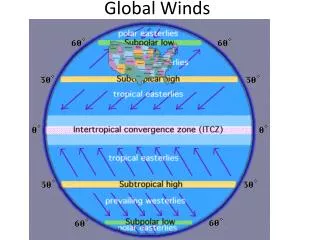
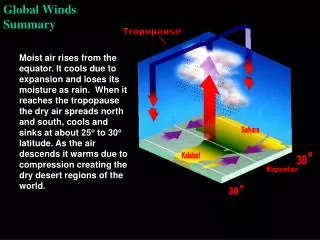
Global Pressure and Wind Belts On average, low pressure exists at 0° and 60° and high pressure at 30° and 90°. Each hemisphere can be divided into three wind belts, with winds angling toward low pressure in each belt, namely, 1. Easterly trade winds from the equator to 30° 2. Variable prevailing westerlies from 30° to 60° 3. Variable polar easterlies from 60° to the Poles Trade Winds, named for their reliability, dominate the tropics. They are easterlies that blow toward the equator. Near the heart of their realm, between about 15° and 20° latitude, they are among the steadiest winds on Earth. However, as the Trade Winds from each hemisphere approach each other near the equator, they weaken and become irregular. There they form a region of frequent calms called the Doldrums. The region where the trade winds converge is the InterTropical Convergence Zone (ITCZ). There the air rises to form the Tropical Rain Belt, which waters the world’s tropical rainforests. After rising, the air spreads out from the ITCZ and sinks on both sides of it, causing clear weather. The trade winds thus complete a circulation cell, called the Hadley cell
Many figures at http://www.ux1.eiu.edu/~cfjps/1400/FIG07_015.jpg See also animation at http://www.suu.edu/faculty/colberg/Hazards/Weather/04_GlobalWind.html
Winds Outside the Tropics (Extratropical) Outside the tropics the winds are highly variable, seldom coming from the same direction more than two days in a row. Moving low and high pressure areas turn the winds in every direction as they transport the excess heat of the tropics to the polar regions. Therefore, it is only in an average sense that mid-latitude winds are westerly and Polar winds are easterly. In fact, when the Polar winds of the North Hemisphere are averaged the residue is so small it has been called an area of polar calms. The westerly winds that prevail in the mid latitudes are especially strong in the South Hemisphere, where there is little land to divert or block them. Nicknamed the Roaring Forties, they raise towering ocean waves. When Magellan first encountered their fury he was delayed six months in his attempt to circle the world from east to west. Most sailors now bow before the winds and head to the east to circumnavigate the globe. In the next two slides, variability of extratropical winds (and temperatures) is illustrated by showing two 850 mb charts (about 1 mile above sea level) only 5 days apart.
Columbus and Global Scale Winds Columbus was an expert sailor with a extraordinary knowledge of the global winds. He did not attempt to sail into the teeth of the Prevailing Westerly winds, but first turned south and then used the Easterly Trade Winds to drive his ships across the Ocean. On the return voyage, he headed north and then used the Prevailing Westerlies to propel his ships back to Europe, stopping at the Azores on the way for much needed repairs. His educated guess that wind belts were essentially latitude belts was crucial to discovery and economics. Prevailing Westerlies
The Great Wind Gyres The continents divert the simple global wind belts into great wind gyres that move and change with the seasons. The main impact of land and sea on the global winds can be reduced to a single rule: At any latitude, pressure tends to be high where temperature is low. In the subtropics the sea is cooler than the land, particularly during the summer when the land gets very hot. By contrast, in subpolar latitudes, the oceans are warmer than the land except in high summer. Therefore, 1. Highs cover each ocean around 30° latitude, especially in summer. 2. Lows cover each ocean around 60° latitude except in mid summer.
Seasonal Changes of the Winds The major wind belts both move and change with the seasons. The golden rule of seasonal wind changes is, Global wind systems follow the Sun. During July, when the Sun and the warmest air are north of the Equator, the ITCZ, the subtropical highs, and the subpolar lows are farther north than in January. Many of the resulting seasonal changes in the winds at particular locations are due to the movement of the wind systems. The paradigm example of seasonally reversing winds is the Asian Monsoon. In July, the ITCZ is north of the Equator. Hot, light air rises over the heated Asian landmass where pressure is low. Cooler air from the surrounding oceans rushes in like a giant sea breeze, transporting great quantities of moisture inland.In January a huge high pressure area of frigid air forms in the heart of Siberia. The cold air drains across China and out over the Pacific Ocean, much like a land breeze does along coastal regions at night. Whenever the wind crosses the Equator the Coriolis force changes direction and deflects the wind from west to the east. For example in July, the wind of the Indian Monsoon originates over the South Indian Ocean as a typical southeast trade wind. But after crossing the equator, the Coriolis force turns the wind to its right so that it strikes India from the southwest.
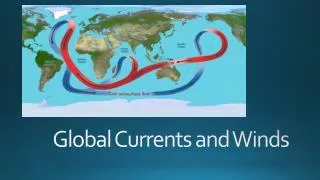
Global Winds and Ocean Currents Surface ocean currents are so closely linked to the global winds that once you know the pattern of global winds you know most of the major currents as well. Ocean currents flow like wide, lazy rivers. Most are hundreds of miles wide and flow at less than 1 knot (1.15 mph). The Gulf Stream is one most intense and narrowest currents, reaching speeds of 4 knots (4.6 mph) as it passes through the Straits of Florida, where it is about 60 miles (100 km) wide and 2500 feet (750 m) deep. The primary driving force for most surface ocean currents is the drag of the wind on the water, but they are also affected by the Coriolis force, and confined within the ocean basins. As a result, The major surface ocean currents flow almost parallel to the isobars of the large pressure systems. For example, the major surface currents in the North Atlantic Ocean form a large clockwise gyre around the subtropical Bermuda-Azores High. But the currents are not symmetric. On the east side of the Atlantic near Africa the Canaries Current is relatively wide and slow. On the west side, the Gulf Stream is narrow and intense, and beyond Cape Hatteras it breaks down into a series of beautiful meanders and loops. The temperature of the currents largely follows the simple rule that, Cold currents flow from the poles;warm currents flow from the equator.
Temperature and Salinity: The Deep Oceans The warm water covering most of the summer and tropical oceans is just a thin veneer on the surface, about 200 m deep. Below that, temperature drops sharply across a front-like boundary called the thermocline. Frigid water with Temperature from 2 4°C sinks in the Polar regions and fills the depths of the great ocean basins. The coldest, densest water sinks from the edge of Antarctica to the ocean floor and oozes northward. Almost equally cold Arctic water sinks into the depths of the Atlantic Ocean, drifts southward for thousands of miles, and eventually flows into the Indian and Pacific Oceans. The cold waters gradually well up toward the surface in a huge oceanic conveyer belt. Most cold surface currents are cold mainly because they upwell frigid waters from the depths (and less because they may come from the Poles)! Salinity of the water is affected by climate but in turn affects currents. Salinity is low where P > E (Precipitation exceeds Evaporation) because precipitation provides fresh water, as in the polar waters. Salinity is high where E > P, because when water evaporates the salt remains behind, as in the subtropics. Saline waters are dense and tend to sink. Water leaving the Mediterranean is so salty it sinks to mid ocean depths despite its warmth.
The Oceans’ Vertical Temperature and Density Profiles www.windows.ucar.edu/tour/ link=/earth/Water/temp.html&edu=high - 16k -
Cross Section of Ocean Temperature and Circulation Surface Veneer and Dome of Warm Water North Atlantic Deep Water Antarctic Bottom Water
Upwelling and the Ekman Spiral Wind driven surface ocean currents move at 45° to the left of the wind in the South Hemisphere. With depth the current continues turning left and decreasing in speed. The net flow of water is 90° to the left of the wind. When winds parallel the coast, as against South America, colder water from the depths is forced to rise. This is called upwelling.
Cold and Warm Surface Ocean Currents Since cold water is too dense to rise naturally, upwelling must be forced by the winds. Along coastlines, upwelling occurs when the wind blows the surface waters out to sea. This lowers sea level slightly along the coast and lifts the cold waters. The world’s main upwelling regions occur off the west coasts of the continents in subtropical latitudes. Persistent winds blow almost parallel to the shoreline but the Coriolis force moves the surface water to the right of the wind in the North Hemisphere and to the left of the wind in the South Hemisphere. For example, winds blow northward on the west coast of South America, driving the Peru or Humboldt Current and forcing surface waters to the west out to sea, so cold water upwells. The cold water chills the sinking air of the east side of the subtropical high, causing persistent fog and low clouds, but virtually eliminating rain. Along the Equator, upwelling often extends far out to sea. Easterly trade winds in each hemisphere deflect the currents away from the Equator, forcing the surface waters to diverge and upwell. The largest strip of cold equatorial water stretches from Colombia half way across the Pacific Ocean, suppressing convective clouds and occasionally causing a clear alley in the ITCZ. Thus, the Gulf Stream and its continuation, the North Atlantic Current are warm, and are responsible for West Europe’s abnormally mild winters for such high latitudes. Conversely, the Canary Current, which flows toward the Equator, is cool and keeps Morocco from broiling during the summer. The Peru or Humboldt Current likewise keeps Peru and the northern half of Chile cool and foggy, but almost rainless.
Global Winds and Precipitation Global precipitation patterns are closely tied to the winds. Since precipitation is produced by rising air, Precipitation is abundant where air rises and scanty where air sinks. The key then is to find where the air rises and where it sinks. Air rises where the, 1. Atmosphere is unstable, as in thunderstorms. 2. Surface winds converge, as in the ITCZ or low pressure areas. 3. Wind strikes a mountain slope. Despite all the irregularities imposed by geography, world maps of precipitation are dominated by a few major patterns, such as, 1. Precipitation (like temperature) generally decreases with latitude. 2. The Tropics (0 to 10° latitude) are rainy 3. The Subtropics (20 to 30° latitude) are dry except on East Coasts. 4. The interiors of continents surrounded by mountain ranges are dry. 5. West coasts are drier than East coasts from 0 to about 40 latitude 6. West coasts are wetter than East coasts above about 45 latitudes.
The Tropical Rain Belt As the ITCZ moves north and south in pursuit of the Sun, it causes the pronounced wind shifts and celebrated rainy seasons of the monsoons. When the sun and ITCZ are furthest north around July, tropical rains fall from the equator to about 20°N latitude. At the same time, the latitudes from around 5 to 30°S are bone dry. Then, as the Sun turns south the rain belt follows. In January, the rainbelt is centered south of the equator. Rains fall from 0 to 20°S, while the latitudes from 5 to 30°N tend to be bone dry. The ITCZ is wide enough to give the equator rain all year, but many places near the equator have two distinct rainy peaks when the heart of the rainbelt passes overhead. Thus, tropical climates are, 1. Rainy all year from 0 to 5° latitude. 2. Rainy during high sun and dry during low sun from 5 to 20°. 3. Dry all year from 20 to 30° except on the east sides of the continents. These features are illustrated in the next slide for the Asian Monsoon.
Tropical Rainbelt: Monsoon Wind systems and rain belts move with the Sun. This gives rise to rainy and dry seasons, i. e. monsoons. (mausim = season) In January, the Sun and region of hot rising air (ITCZ or tropical rain belt) are south of the Equator In July, the Sun and region of hot rising air (ITCZ or tropical rain belt) are north of the equator.
West Coast Wind and Weather Changes An annual cycle of wind and rain occurs on the west coasts of all the continents in the mid latitudes. In summer, the subtropical highs over the oceans strengthen and drift poleward and eastward, until they cover the west coasts with sinking, downslope easterly winds. Thus summer has little or no rain between about 10° and 45° latitude. Further poleward, westerly winds and occasional passing low pressure areas bring some summer rains. During winter, the highs weaken, retreat equatorward, and move away from land. Westerly winds and passing lows from the mid latitude rain belt then strike the west coasts with increased frequency, bringing rains down to about 30° latitude. As a result, West Coasts are, 1. Dry all year from about 10° to 30° latitude. 2. Rainy in winter and dry in summer between about 30° and 45° latitude. 3. Rainy all year above 45° latitude. These features are illustrated in the next slide for North America’s west coast.
Winds Aloft Winds aloft are usually faster than winds at the surface for two reasons. First, friction is greatest at the ground but is hardly felt aloft. Second, the temperature gradients that drive the winds generally persist through the troposphere. This increases the slope of the isobaric surfaces with height and according to the geostrophic wind relation, simultaneously increases wind speed with height. In general, temperature decreases from the tropics to the poles. This makes the isobaric surfaces slope down toward the poles and leads to west winds that increase in speed with height. The jet stream, which marks the fastest winds therefore also marks the boundary between tropical and polar air. An exception occurs during July, when the hottest air occurs well north of the equator over Africa and southern Asia. As a result, an easterly jet stream forms between the Equator and about 5 to 25° N latitude. One result of these strong easterly winds is to prevent hurricane formation in the Bay of Bengal from July through mid-October. The winds aloft also drive storms along storm tracks. Storms in the Tropics generally move from East to West because the winds aloft generally blow from the east. Storms outside the tropics generally move from West to East because the winds aloft generally blow from west to east, often parallel to the jet stream.
During January the domain of Polar air expands toward the Equator so the Jet Stream occurs closer to the Equator http://www.ux1.eiu.edu/~cfjps/1400/FIG07_015.jpg
The N-S temperature patterns give rise to E-W winds. T decreases with height, and toward the Poles but is almost constant at any height in the Tropics. The coldest temperatures of the troposphere occur over the Equator! http://www-paoc.mit.edu/labweb/notes/chap5.pdf
Zonal Wind Speed in the Troposphere – Jun, July, Aug E W W E Easterlies dominate the tropics. Near the ground they are fastest South of the Equator while at Jet Stream levels they are fastest North of the Equator. Westerlies dominate outside the tropics and are faster in the South Hemisphere, where it is winter. West winds strengthen with height to the Jet Stream.
Zonal Wind Speed in the Troposphere – Dec, Jan, Feb W W E E Easterlies still dominate the tropics and Westerlies dominate outside the tropics but the picture now (DJF) looks like the mirror image about the Equator of the picture of JJA.