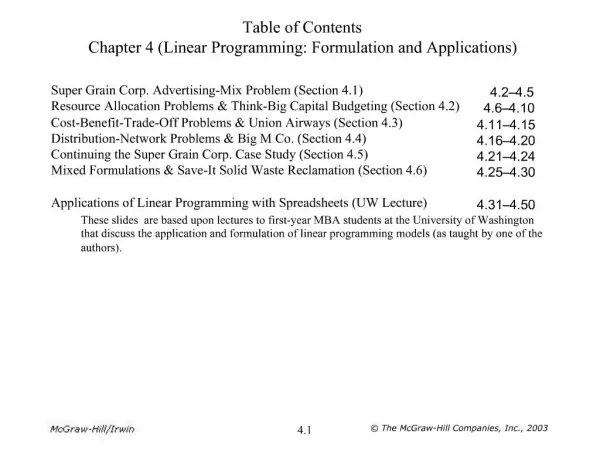
Chapter 4 Linear Programming Applications
Chapter 4 Linear Programming Applications. Blending Problem Portfolio Planning Problem Product Mix Problem Transportation Problem Data Envelopment Analysis Revenue Management. Blending Problem. Ferdinand Feed Company receives four raw

Chapter 4 Linear Programming Applications
E N D
Presentation Transcript
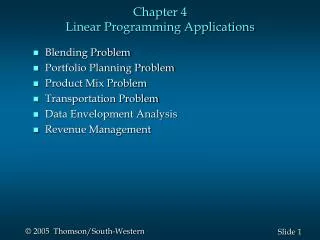
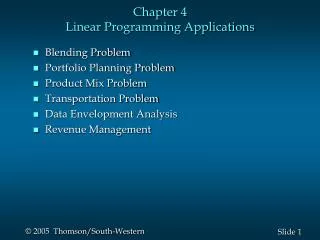
Chapter 4 Linear Programming Applications • Blending Problem • Portfolio Planning Problem • Product Mix Problem • Transportation Problem • Data Envelopment Analysis • Revenue Management
Blending Problem Ferdinand Feed Company receives four raw grains from which it blends its dry pet food. The pet food advertises that each 8-ounce packet meets the minimum daily requirements for vitamin C, protein and iron. The cost of each raw grain as well as the vitamin C, protein, and iron units per pound of each grain are summarized on the next slide.
Blending Problem Vitamin C Protein Iron Grain Units/lb Units/lb Units/lb Cost/lb 1 9 12 0 .75 2 16 10 14 .90 3 8 10 15 .80 4 10 8 7 .70 Ferdinand is interested in producing the 8-ounce mixture at minimum cost while meeting the minimum daily requirements of 6 units of vitamin C, 5 units of protein, and 5 units of iron.
Blending Problem • Define the decision variables xj = the pounds of grain j (j = 1,2,3,4) used in the 8-ounce mixture • Define the objective function Minimize the total cost for an 8-ounce mixture: MIN .75x1 + .90x2 + .80x3 + .70x4
Blending Problem • Define the constraints Total weight of the mix is 8-ounces (.5 pounds): (1) x1 + x2 + x3 + x4 = .5 Total amount of Vitamin C in the mix is at least 6 units: (2) 9x1 + 16x2 + 8x3 + 10x4 > 6 Total amount of protein in the mix is at least 5 units: (3) 12x1 + 10x2 + 10x3 + 8x4 > 5 Total amount of iron in the mix is at least 5 units: (4) 14x2 + 15x3 + 7x4 > 5 Nonnegativity of variables: xj> 0 for all j
Blending Problem • The Management Scientist Output OBJECTIVE FUNCTION VALUE = 0.406 VARIABLEVALUEREDUCED COSTS X1 0.099 0.000 X2 0.213 0.000 X3 0.088 0.000 X4 0.099 0.000 Thus, the optimal blend is about .10 lb. of grain 1, .21 lb. of grain 2, .09 lb. of grain 3, and .10 lb. of grain 4. The mixture costs Frederick’s 40.6 cents.
Portfolio Planning Problem Winslow Savings has $20 million available for investment. It wishes to invest over the next four months in such a way that it will maximize the total interest earned over the four month period as well as have at least $10 million available at the start of the fifth month for a high rise building venture in which it will be participating.
Portfolio Planning Problem For the time being, Winslow wishes to invest only in 2-month government bonds (earning 2% over the 2-month period) and 3-month construction loans (earning 6% over the 3-month period). Each of these is available each month for investment. Funds not invested in these two investments are liquid and earn 3/4 of 1% per month when invested locally.
Portfolio Planning Problem Formulate a linear program that will help Winslow Savings determine how to invest over the next four months if at no time does it wish to have more than $8 million in either government bonds or construction loans.
Portfolio Planning Problem • Define the decision variables gj = amount of new investment in government bonds in month j cj = amount of new investment in construction loans in month j lj = amount invested locally in month j, where j = 1,2,3,4
Portfolio Planning Problem • Define the objective function Maximize total interest earned over the 4-month period. MAX (interest rate on investment)(amount invested) MAX .02g1 + .02g2 + .02g3 + .02g4 + .06c1 + .06c2 + .06c3 + .06c4 + .0075l1 + .0075l2 + .0075l3 + .0075l4
Portfolio Planning Problem • Define the constraints Month 1's total investment limited to $20 million: (1) g1 + c1 + l1 = 20,000,000 Month 2's total investment limited to principle and interest invested locally in Month 1: (2) g2 + c2 + l2 = 1.0075l1 or g2 + c2 - 1.0075l1 + l2 = 0
Portfolio Planning Problem • Define the constraints (continued) Month 3's total investment amount limited to principle and interest invested in government bonds in Month 1 and locally invested in Month 2: (3) g3 + c3 + l3 = 1.02g1 + 1.0075l2 or - 1.02g1 + g3 + c3 - 1.0075l2 + l3 = 0
Portfolio Planning Problem • Define the constraints (continued) Month 4's total investment limited to principle and interest invested in construction loans in Month 1, goverment bonds in Month 2, and locally invested in Month 3: (4) g4 + c4 + l4 = 1.06c1 + 1.02g2 + 1.0075l3 or - 1.02g2 + g4 - 1.06c1 + c4 - 1.0075l3 + l4 = 0 $10 million must be available at start of Month 5: (5) 1.06c2 + 1.02g3 + 1.0075l4> 10,000,000
Portfolio Planning Problem • Define the constraints (continued) No more than $8 million in government bonds at any time: (6) g1< 8,000,000 (7) g1 + g2< 8,000,000 (8) g2 + g3< 8,000,000 (9) g3 + g4< 8,000,000
Portfolio Planning Problem • Define the constraints (continued) No more than $8 million in construction loans at any time: (10) c1< 8,000,000 (11) c1 + c2< 8,000,000 (12) c1 + c2 + c3< 8,000,000 (13) c2 + c3 + c4< 8,000,000 Nonnegativity: gj, cj, lj> 0 for j = 1,2,3,4
Product Mix Problem Floataway Tours has $420,000 that can be used to purchase new rental boats for hire during the summer. The boats can be purchased from two different manufacturers. Floataway Tours would like to purchase at least 50 boats and would like to purchase the same number from Sleekboat as from Racer to maintain goodwill. At the same time, Floataway Tours wishes to have a total seating capacity of at least 200.
Product Mix Problem Formulate this problem as a linear program. Maximum Expected Boat Builder Cost Seating Daily Profit Speedhawk Sleekboat $6000 3 $ 70 Silverbird Sleekboat $7000 5 $ 80 Catman Racer $5000 2 $ 50 Classy Racer $9000 6 $110
Product Mix Problem • Define the decision variables x1 = number of Speedhawks ordered x2 = number of Silverbirds ordered x3 = number of Catmans ordered x4 = number of Classys ordered • Define the objective function Maximize total expected daily profit: Max: (Expected daily profit per unit) x (Number of units) Max: 70x1 + 80x2 + 50x3 + 110x4
Product Mix Problem • Define the constraints (1) Spend no more than $420,000: 6000x1 + 7000x2 + 5000x3 + 9000x4< 420,000 (2) Purchase at least 50 boats: x1 + x2 + x3 + x4> 50 (3) Number of boats from Sleekboat equals number of boats from Racer: x1 + x2 = x3 + x4 or x1 + x2 - x3 - x4 = 0
Product Mix Problem • Define the constraints (continued) (4) Capacity at least 200: 3x1 + 5x2 + 2x3 + 6x4> 200 Nonnegativity of variables: xj> 0, for j = 1,2,3,4
Product Mix Problem • Complete Formulation Max 70x1 + 80x2 + 50x3 + 110x4 s.t. 6000x1 + 7000x2 + 5000x3 + 9000x4< 420,000 x1 + x2 + x3 + x4> 50 x1 + x2 - x3 - x4 = 0 3x1 + 5x2 + 2x3 + 6x4> 200 x1, x2, x3, x4> 0
Product Mix Problem • Partial Spreadsheet Showing Problem Data
Product Mix Problem • Partial Spreadsheet Showing Solution
Product Mix Problem • The Management Science Output OBJECTIVE FUNCTION VALUE = 5040.000 VariableValueReduced Cost x1 28.000 0.000 x2 0.000 2.000 x3 0.000 12.000 x4 28.000 0.000 ConstraintSlack/SurplusDual Price 1 0.000 0.012 2 6.000 0.000 3 0.000 -2.000 4 52.000 0.000
Product Mix Problem • Solution Summary • Purchase 28 Speedhawks from Sleekboat. • Purchase 28 Classy’s from Racer. • Total expected daily profit is $5,040.00. • The minimum number of boats was exceeded by 6 (surplus for constraint #2). • The minimum seating capacity was exceeded by 52 (surplus for constraint #4).
Product Mix Problem • Sensitivity Report
Product Mix Problem • Sensitivity Report
Transportation Problem The Navy has 9,000 pounds of material in Albany, Georgia that it wishes to ship to three installations: San Diego, Norfolk, and Pensacola. They require 4,000, 2,500, and 2,500 pounds, respectively. Government regulations require equal distribution of shipping among the three carriers.
Transportation Problem The shipping costs per pound for truck, railroad, and airplane transit are shown on the next slide. Formulate and solve a linear program to determine the shipping arrangements (mode, destination, and quantity) that will minimize the total shipping cost.
Transportation Problem Destination Mode San Diego Norfolk Pensacola Truck $12 $ 6 $ 5 Railroad 20 11 9 Airplane 30 26 28
Transportation Problem • Define the Decision Variables We want to determine the pounds of material, xij , to be shipped by mode i to destination j. The following table summarizes the decision variables: San Diego Norfolk Pensacola Truckx11x12x13 Railroad x21x22x23 Airplane x31x32x33
Transportation Problem • Define the Objective Function Minimize the total shipping cost. Min: (shipping cost per pound for each mode per destination pairing) x (number of pounds shipped by mode per destination pairing). Min: 12x11 + 6x12 + 5x13 + 20x21 + 11x22 + 9x23 + 30x31 + 26x32 + 28x33
Transportation Problem • Define the Constraints Equal use of transportation modes: (1) x11 + x12 + x13 = 3000 (2) x21 + x22 + x23 = 3000 (3) x31 + x32 + x33 = 3000 Destination material requirements: (4) x11 + x21 + x31 = 4000 (5) x12 + x22 + x32 = 2500 (6) x13 + x23 + x33 = 2500 Nonnegativity of variables: xij> 0, i = 1,2,3 and j = 1,2,3
Transportation Problem • Partial Spreadsheet Showing Problem Data
Transportation Problem • Partial Spreadsheet Showing Solution
Transportation Problem • The Management Scientist Output OBJECTIVE FUNCTION VALUE = 142000.000 VariableValueReduced Cost x11 1000.000 0.000 x12 2000.000 0.000 x13 0.000 1.000 x21 0.000 3.000 x22 500.000 0.000 x23 2500.000 0.000 x31 3000.000 0.000 x32 0.000 2.000 x33 0.000 6.000
Transportation Problem • Solution Summary • San Diego will receive 1000 lbs. by truck and 3000 lbs. by airplane. • Norfolk will receive 2000 lbs. by truck and 500 lbs. by railroad. • Pensacola will receive 2500 lbs. by railroad. • The total shipping cost will be $142,000.
Data Envelopment Analysis • Data envelopment analysis (DEA) is an LP application used to determine the relative operating efficiency of units with the same goals and objectives. • DEA creates a fictitious composite unit made up of an optimal weighted average (W1, W2,…) of existing units. • An individual unit, k, can be compared by determining E, the fraction of unit k’s input resources required by the optimal composite unit. • If E < 1, unit k is less efficient than the composite unit and be deemed relatively inefficient. • If E = 1, there is no evidence that unit k is inefficient, but one cannot conclude that k is absolutely efficient.
Data Envelopment Analysis • The DEA Model MIN E s.t. Weighted outputs > Unit k’s output (for each measured output) Weighted inputs <E [Unit k’s input] (for each measured input) Sum of weights = 1 E, weights > 0
Data Envelopment Analysis The Langley County School District is trying to determine the relative efficiency of its three high schools. In particular, it wants to evaluate Roosevelt High. The district is evaluating performances on SAT scores, the number of seniors finishing high school, and the number of students who enter college as a function of the number of teachers teaching senior classes, the prorated budget for senior instruction, and the number of students in the senior class.
Data Envelopment Analysis • Input RooseveltLincolnWashington Senior Faculty 37 25 23 Budget ($100,000's) 6.4 5.0 4.7 Senior Enrollments 850 700 600
Data Envelopment Analysis • Output RooseveltLincolnWashington Average SAT Score 800 830 900 High School Graduates 450 500 400 College Admissions 140 250 370
Data Envelopment Analysis • Decision Variables E = Fraction of Roosevelt's input resources required by the composite high school w1 = Weight applied to Roosevelt's input/output resources by the composite high school w2 = Weight applied to Lincoln’s input/output resources by the composite high school w3 = Weight applied to Washington's input/output resources by the composite high school
Data Envelopment Analysis • Objective Function Minimize the fraction of Roosevelt High School's input resources required by the composite high school: MIN E
Data Envelopment Analysis • Constraints Sum of the Weights is 1: (1) w1 + w2 + w3 = 1 Output Constraints: Since w1 = 1 is possible, each output of the composite school must be at least as great as that of Roosevelt: (2) 800w1 + 830w2 + 900w3> 800 (SAT Scores) (3) 450w1 + 500w2 + 400w3> 450 (Graduates) (4) 140w1 + 250w2 + 370w3> 140 (College Admissions)
Data Envelopment Analysis • Constraints Input Constraints: The input resources available to the composite school is a fractional multiple, E, of the resources available to Roosevelt. Since the composite high school cannot use more input than that available to it, the input constraints are: (5) 37w1 + 25w2 + 23w3< 37E (Faculty) (6) 6.4w1 + 5.0w2 + 4.7w3< 6.4E (Budget) (7) 850w1 + 700w2 + 600w3< 850E (Seniors) Nonnegativity of variables: E, w1, w2, w3> 0
Data Envelopment Analysis • The Management Scientist Output OBJECTIVE FUNCTION VALUE = 0.765 VARIABLEVALUE REDUCED COSTS E 0.765 0.000 W1 0.000 0.235 W2 0.500 0.000 W3 0.500 0.000
Data Envelopment Analysis • The Management Scientist Output CONSTRAINTSLACK/SURPLUSDUAL PRICES 1 0.000 -0.235 2 65.000 0.000 3 0.000 -0.001 4 170.000 0.000 5 4.294 0.000 6 0.044 0.000 7 0.000 0.001
Data Envelopment Analysis • Conclusion The output shows that the composite school is made up of equal weights of Lincoln and Washington. Roosevelt is 76.5% efficient compared to this composite school when measured by college admissions (because of the 0 slack on this constraint (#4)). It is less than 76.5% efficient when using measures of SAT scores and high school graduates (there is positive slack in constraints 2 and 3.)