Download
1 / 18
180 likes | 387 Vues
The Urban Heat Island Experiment. Dr Sylvia Knight FRMetS Head of Education & Continuous Learning Royal Meteorological Society education@rmets.org. http://news.bbc.co.uk/1/hi/england/7929584.stm. Urban Heat Islands.

E N D
The Urban Heat Island Experiment Dr Sylvia Knight FRMetS Head of Education & Continuous Learning Royal Meteorological Society education@rmets.org http://news.bbc.co.uk/1/hi/england/7929584.stm
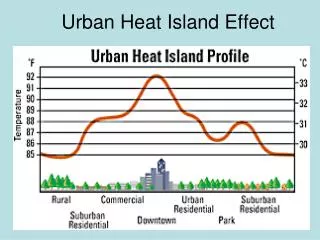
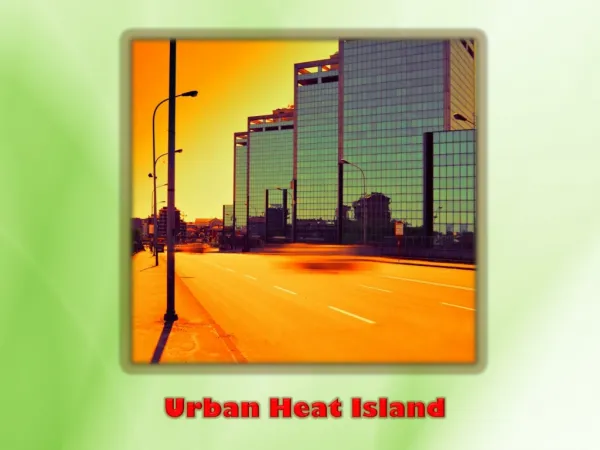
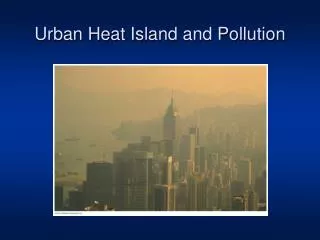
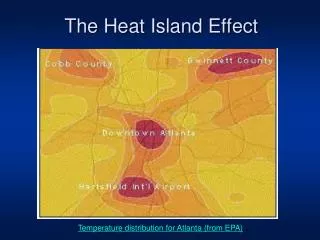
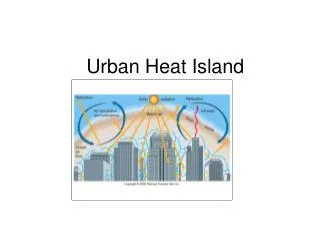
Urban Heat Islands An urban heat island is a metropolitan area which is significantly warmer than its surrounding rural areas. Causes: • There is little bare earth and vegetation in urban areas. • Less energy is used up evaporating water, • Less of the Sun's energy is reflected • More heat is stored by buildings and the ground • The heat generated by heating, cooling, transport and other energy uses • The complex three dimensional structure of the urban landscape.
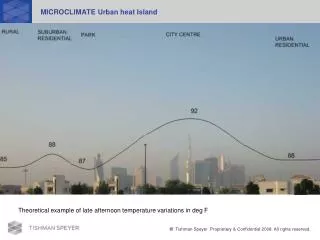
The temperature difference is usually larger at night than during the day, and usually larger in the summer than in the winter, and is most obvious when winds are weak and skies are clear.
Excess mortality rates in early August 2003 indicate about 40,000 heat-related deaths Daily mortality in Baden-Württemberg
observations HadCM3 Medium-High 2050s 2003 Temperature anomaly (wrt 1961-90) °C European 2003 summer temperatures
What’s that got to do with the UHI? • London – 600 heat related deaths • Up to 9 °C warmer than surrounding rural areas • Mortality increases when temperatures are over 22°C • Mortality particularly linked to warm night time temperatures • Mortality linked to age, sex, deprivation etc. • Challenge now to design buildings and urban areas for the future
The RMetS Big Urban Heat Island Experiment Generate data sets for most of the major UK cities and towns Raise understanding of urban heat islands amongst the general public Make the data available to teachers in a user friendly format Generate data which researchers and planners can use as well Raise the profile of the RMetS amongst teachers!
Public Involvement • Reliant on local media & contacts with local groups etc. • Any thermometer available • Car thermometers • Text in temperature & postcode at home or on arrival at destination
Schools Involvement • Wrote to all schools in Greater Manchester, inviting them to participate. • Hundreds of simple, calibrated digital thermometers. • Letters to all parents.
SCORCHIO Sustainable Cities: Options for Responding to Climate cHange Impacts and Outcomes • Develop a detailed picture of the spatial temperature patterns across Greater Manchester • Develop a suite of GIS-based decision-support tools which will allow for the analysis of climate change adaptation options in urban areas, with a particular emphasis on heat and human comfort
Altrincham girls grammar school involvement • Heads of science and geography got involved, together with a ‘champion’ group of girls taken from years 10-13 • Distributed 200 thermometers to students in the school and in primary schools in their area • Ran year group assemblies for classes through the school • Coordinated the press involvement with the project • Collected data and thermometers as pupils arrived for school, drawing their own results map
Data collected: • Over 1000 data points collected from that one morning! • 300 texts sent in by the general public • 320 results collected by Altrincham grammar and 3 other schools • Remaining data collected from ‘serious amateurs’, and ‘official’ weather stations around Manchester • Not all the data could be used.
And Finally… Coming soon – Birmingham, Edinburgh…..etc. www.metlink.org/urban