Download
1 / 16
160 likes | 309 Vues
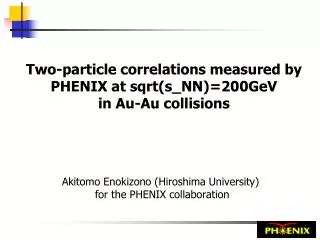
Two-particle correlations measured by PHENIX at sqrt(s_NN)=200GeV in Au-Au collisions. Akitomo Enokizono (Hiroshima University) for the PHENIX collaboration. Source size. Hadron phase. Physics motivation. Duration time. Au. Au. Fire ball. QGP phase. Mixed phase. Observation.

E N D
Two-particle correlations measured by PHENIX at sqrt(s_NN)=200GeV in Au-Au collisions Akitomo Enokizono (Hiroshima University) for the PHENIX collaboration
Source size Hadron phase Physics motivation Duration time Au Au Fire ball QGP phase Mixed phase Observation Some models predict that the source size will become bigger and duration time become longer via QGP phase STAR PHENIX PHENIX and STAR results show that source radii don’t increase and no duration time at sqrt(sNN)=130GeV Phys. Rev. Lett. 88 192302
Bertsch-Pratt source radii The duration time In LCMS frame y Detector Detector Au Beam axis x source source Rout (RTO) Rlong (RL) z Rside (RTS) Au Beam axis
Data statistics from PHENIX Run2 • About 50M minimum bias event. • Z-vertex < 30 cm • pT>0.2GeV/c • Charged pi, K PID by EMCal • 1.5 within pi mass, (and 2.0 away from K mass) • 1.5 within K mass, (and 2.5 away from p, pi mass)
Corrections & systematic errors • Pair cuts • Tracking inefficiency cut • Ghost track cut • Cluster sharing cut • Coulomb correction • The Coulomb effect is corrected by full coulomb correction with momentum smearing.
3-D correlation result of charged pions PHENIX PRELIMINARY 200 GeV Au+Au、Top 30% Centrality, 0.2<kT<2.0GeV/c, <kT>=0.46GeV/c λ = 0.397 ± 0.015 Rside = 4.40 ± 0.12 Rout = 3.73 ± 0.12 [fm] Rlong = 4.82 ± 0.15 λ = 0.434 ± 0.018 Rside = 4.58 ± 0.14 Rout = 3.88 ± 0.14 [fm] Rlong = 5.24 ± 0.18
kT and centrality selections Charged pion correlations are measured in 9 kT and centrality regions. • Centrality class is defined by BBC vs. ZDC. • The number of participants is estimated with Glauber model. We can see “x-p correlation” if there is collective expansion of the source
kT dependence of source radii Centrality is in top 30%
Comparison with hydrodynamic model Centrality is in top 30% Recent hydrodynamic calculation by U.Heinz and P. F. Kolb (hep-ph/0204061) Hydro w/o FS • Standard initialization and freeze out which reproduce single particle spectra. Hydro at ecrit • Assuming freeze out directly at the hadronization point. (edec = ecrit) kT dependence of Rlong indicates the early freeze-out?
kT dependence of Rout/Rside The duration time
Centrality dependence of source radii 0.2<kT<2.0GeV/c, <kT>=0.46GeV/c Fit with p0+p1*Npart^1/3 Rlong increases rapidly with the Npart than Rout.
Centrality dependence of Rout/Rside 0.2<kT<2.0GeV/c ,<kT>=0.46GeV/c
1-D results of new HBT analysis method PHENIX PRELIMINARY Calculated with a new HBT analysis method. (based on imaging) M. Heffner present at the poster session in detail.
3-D correlation results of charged kaons 200 GeV Au+Au、Top 30% Centrality, 0.2<kT<2.0GeV/c, <kT>=0.76GeV/c λ = 0.815 0.181 Rside = 4.18 0.54 Rout = 3.72 0.69 [fm] Rlong = 4.27 0.65 λ = 0.785 0.181 Rside = 3.65 0.43 Rout = 3.23 0.47 [fm] Rlong = 4.48 0.68
Comparison of kaon to pion In the most 30% central
Summary • Using a first data sample from PHENIX Run2 (sqrt(s_NN)=200 GeV Au+Au), we have analyzed 164M pi+(157M pi-) pairs, and 1.2M K+(1.1M K-) kaon pairs. • HBT source radii are consistent between 130 and 200 GeV. • All HBT source radii decrease with kT. • Rout/Rside is independent on the kT up to ~1GeV/c. • Rout/Rside 1. • Kaon HBT is comparable or larger than pion HBT at same <kT>. • HBT at larger range of kT will test transport models…