Climate change and climate feedbacks
Climate change and climate feedbacks. Christopher S. Bretherton Department of Atmospheric Sciences University of Washington Seattle, WA USA. 1864-1883 range. 1988-2007 range. Weather = climate +. Global surface temperature - a good climate metric.

Climate change and climate feedbacks
E N D
Presentation Transcript
Climate change and climate feedbacks Christopher S. Bretherton Department of Atmospheric Sciences University of Washington Seattle, WA USA
1864-1883 range 1988-2007 range Weather = climate +
Global surface temperature - a good climate metric • Reliably derivable from observations for the last century. • Averages out regional variations • Unforced interannual variability ≈ ± 0.1ºC • Well correlated with multidecadal regional variations. IPCC 2007
The simple core of global warming • Absorbed sunlight heats Earth • Warm surfaces radiate more energy. • Earth warms until radiated infrared energy balances absorbed sunlight • CO2, a greenhouse gas, intercepts Earth’s infrared radiation, reducing surface cooling efficiency. • With more CO2, surface must warm to bring infrared loss into balance with absorbed sunlight. • Doubled CO2 with no other surface or atmospheric composition changes would raise surface temperature 1.2°C. • Already foreseen by Arrhenius (1895) …global climate models predict more warming due to ‘climate feedbacks’. CO2(ppmv) IPCC 2007
The climate sensitivity problem Models match 20C climate, but vary on 21C warming IPCC 2007 2.5-4.3°C 2xCO2 3xCO2 …though every climate model suggests 21C climate change will probably dwarf the significant changes we’ve seen already.
Manabe and Stouffer 1994 Climate sensitivity Equilibrium climate sensitivity ECS = global surface temperature change due to CO2 doubling after climate equilibrates (takes over 100 years in practice). Transient climate response TCR = global surface temperature change at the time of CO2 doubling when CO2 is increased 1%/year. • TCR is relevant to climate change of the next 50 years. • TCR is smaller than ECS due to ocean thermal inertia. ECS 3.5°C TCR 2.3°C
Intermodel variability of climate sensitivity • ECS of global climate models varies from 2-4.5°C, with a median of 3°C; this range is little-reduced since 1990. • TCR of global climate models is 1.2-2.5°C. IPCC 2007
Global-mean precipitation also increases by 1.5% / °C (but not everywhere!) Climate models agree less well on patterns of rainfall change than those of temperature change, but all climate models predict that the more the climate warms, the more rainfall patterns will change. IPCC 2007 Figure SPM.7
Climate feedbacks atm surf f1: Water vapor + lapse rate: warmer more water vapor f2: Snow/sea ice albedo: warmer less reflective snow/ice f3: Clouds: warmer diverse changes . + long-term feedbacks: icesheets vegetation change carbon cycle (ocean + land) CO2 T f
Climate feedback strengths in climate models Feedback factor f Clouds 0.16±0.05 Albedo 0.06±0.02 Water vapor/ lapse rate 0.25±0.02 0.5 Total 0.48±0.05 0.25 0 IPCC 2007
Water vapor/lapse rate feedback • Air 1°C warmer can hold 7% more water vapor. • Physical processes controlling atmospheric water vapor (evaporation, cloud formation/rainout, vertical motions) tend to maintain constant relative humidity on global scales. Thus atmospheric water vapor increases by ~7%/°C of global warming. • Water vapor is a greenhouse gas feedbackf1 ≈ 30%. • Warming is height-dependent, but overall ‘lapse rate’ + water vapor feedback almost unaltered. Outward Infrared radiation change 20 km T WV warmer climate Height cooler climate sfc Temperature
Observed water vapor feedbacks Satellite observations show mean tropical surface temperature is highly correlated with atmospheric column water vapor. Allan et al. 2003
Snow/ice albedo feedback • In a warmer climate, reflective snow and sea ice decrease, so Earth absorbs more sunlight. • A weak positive feedback in the current climate, but important for amplifying warming at high latitudes. • Much larger if ice sheet changes are considered - responsible for much of ice age temperature fluctuations. • The seasonal cycle of albedo induced by winter snow cover is a good observational test of this feedback in climate models. IPCC 2007 from Hall and Qu 2006
Clouds - the most uncertain climate feedback Clouds are hard to represent in climate models, because: • Often thin, short-lived, • Often produced by small-scale turbulence (e. g. cumuli), • Complex interactions of water and ice particles - High, thin clouds warm (greenhouse effect dominates), - Low clouds cool (shading effect dominates).
Cloud feedbacks in two climate models • decreased in GFDL AM2 (positive albedo feedback) and ECS = 4.5 K • increased in NCAR CAM2 (negative albedo feedback) and ECS = 1.5 K - No good observational test of cloud feedbacks on mean climate! With doubled CO2, low-latitude low-lying clouds systematically:
Some questions raised • Does the significant global warming of the last century observationally constrain climate sensitivity? • Is a CO2-based view of global warming accurate? • Are climate sensitivity uncertainties as large as the climate differences between emissions scenarios? • Should climate sensitivity uncertainties affect current energy policy decisions?
Present climate forcing - it’s not just CO2 Human forcings - greenhouse gases (+) - aerosols (-) - land use, waste heat Natural forcings - volcanoes - solar variability …& on long timescales… - Milankovitch cycles - drifting continents Aerosol effects (esp. from cloud brightening) are the biggest uncertainty. IPCC 2007 Radiative forcing of CO2 doubling = 4 W/m2 = 2% outgoing radiation reduction
Forcing evolution • Until ~1970, aerosols cancelled 1/3-2/3 of greenhouse gases. • Since 1990, aerosols have leveled as US/Europe pollution controls balance Asian industrialization. • In 21st century, trends should be CO2-dominated. IPCC 2007 MIROC models - others vary somewhat
Climate models reproduce 20th century climate well IPCC 2007 break in warming: More aerosols? More eruptions? …but do so through different cancellations of forcings.
Observational estimates of climate sensitivity We’ve had about 1°C of warming, and a 40% CO2 increase since 1850. Can’t we use this to estimate climate sensitivity? - Issue: warming counteracted by uncertain aerosol forcing so possible range is large (ECS > 1.5°C). IPCC 2007 • Glacial-interglacial climate change suggests ECS < 5°C • but climate sensitivity may • depend on climate! All available obs+models are consistent with ECS of 2-4°C
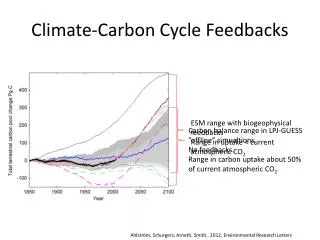
Climate projection IPCC 2007 Climate feedback uncertainty Carbon cycle feedback uncertainty Emissions uncertainty
21st century emissions scenarios Uncertainties reflect carbon cycle feedbacks 2100 1900 2000
By 2070, emission scenario dominates climate change uncertainty B1 A1B A2 …so climate models are ‘skillful’ for energy policy choices.
Fossil CO2 - a cumulative problem Geological burial of CO2 takes 1000s of years! Climate sensitivity affects model response to this.
Melting of Greenland Ice Cap? 4xCO2 Hadley Centre simulations (Ridley et al. 2005) • Complete melting = 7 m sea level rise. • ~50% melting happened 125,000 years ago in the last interglacial with Greenland only 1-3°C warmer than now.
Conclusions • Positive feedbacks in the atmosphere (water vapor, clouds, snow/ice albedo) double the surface warming due to greenhouse gases like CO2. • Climate models agree well on the water vapor feedbacks but differ somewhat on the cloud feedback (and carbon cycle feedbacks). • The ±25% uncertainty this introduces into global temperature projections is less than the differences between reasonable emissions scenarios after 2070. • Fossil CO2 is a cumulative problem. Failure to reduce global CO2 emission within the next 20-40 years will lead to large climate change for hundreds of years. • The countries of the world (including the USA and China) need to change rapidly to energy technologies that do not emit CO2, such as carbon sequestration from coal, wind and solar energy, and nuclear energy.