Download

1 / 19
190 likes | 331 Vues
Industry view on ILUC. Kjell Andersson Svebio and AEBIOM. What I will talk about. Uncertainties and variations in ILUC numbers Land categories and land availability Using historical data to predict the future ”Foregone sequestration” in Europe Yields and by-product

E N D
Industry view on ILUC Kjell Andersson Svebio and AEBIOM
What I will talk about • Uncertainties and variations in ILUC numbers • Land categories and land availability • Using historical data to predict the future • ”Foregone sequestration” in Europe • Yields and by-product • Alternative paths forward • What should EU do?
Global CO2 emissions Emissions from fossil fuel combustion and cement production have increased by more than 2 billion tonnes of coal per year since 2000, whereas the emissions from deforestation have decreased. The share of anthropogenic emissions stemming from deforestation is today less than 10 percent (1 billion tonnes). Source: Global Carbon Project, Friedlingstein et al, Nature Geoscience, November 2010.
Uncertainties in results – variations between studies (g CO2eqv/MJ) • Corn-ethanol 2 – 208 • Wheat-ethanol -53 – 176 • Sugarcane-ethanol -4 – 159 • Soy-biodiesel 1 – 188 • Rape-diesel 1 – 222
Land categories and land availability • The models use a simplified set of land categories (cropland, grassland, forest, etc), but have no separate category for non-used arable land (abandoned land, fallow, set-aside). • The models therefore overestimates the risk for converting forests to cropland. • In the U.S. about one third of the arable land is not used in a fully productive way. In EU at least 10 million hectares of such land (”three Belgium”), and in East Europe much more.
Using historical data to predict the future • The models use historical data for a large number of relations (land conversion rates, yield increases, elasticities, etc) • The assumption is: ”what happened earlier will happen again in the coming years”. • But policy, economic and technical development may change these relations in a fundamental way. • Example 1: Conversion from forest to cropland in Brazil is based on deforestation patterns 2001 – 2007. But deforestation has decreased drastically in the last years. Should Brazilian production in the future be penalised for bad policy in the past? • Example 2: Sustainability criteria in RED will influence land use for biofuels in the near future. Shall we still base models and penalties on policies from before RED?
Deforestation in Amazonas Deforestation in Amazonas in Brazil, millions of hectares/year. Source: INPE (www.obt.inpe.br)
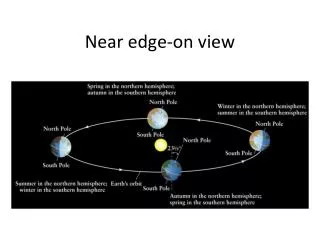
Foregone sequestration in Europe • ”Deforestation” occurring in Europe in the model results is not real deforestation but virtual deforestation, or ”foregone sequestration”. • That is: when a farmer grows rapeseed for biodiesel he or she will be responsible for not letting the forest take over his or her fields and capture carbon. Does that make sense? • Is the ideal that we shall not use our farmland to cultivate crops, but instead use it as carbon sink? • Is this good rural development policy?
Large emissions from forests in Brazil and Europe explain high ILUC-numbers from JCR-IFPRI
Marginal lands in Europa – to use for farming, forestry and/or energy?
Yield responses vary greatly between models • GTAP maizeethanol 43 % • IFPRI-IMPACT cornethanol 80 % • IFPRI-IMPACT wheatethanol 70 % • FAPRI CARD EU wheatethanol 15 % • GTAP rapeseed biodiesel 40 % The same is true for by-products – very big differences between models
AEBIOM’sposition • Land use change issues must be handled where the land use change occurs. ILUC is always dLUC somewhere. • Modelling can not be used as basis for EU regulation – the uncertainties is too big. • The ”science of ILUC” is immature, and needs further development. • Mitigation alternatives: land management policies and investment in agriculture to increase yields. Work together with producer countries.
Policy recommendation • ”Take no action for the time being, while continuing to monitor” – this still holds • NO to an ILUC-factor. Growers and fuel producers can not be held legally accountable for effects that they, by definition, have no influence over.
Thank you for your attention! Kjell.andersson@svebio.se