Welcome to IGCSE Geography
390 likes | 751 Vues
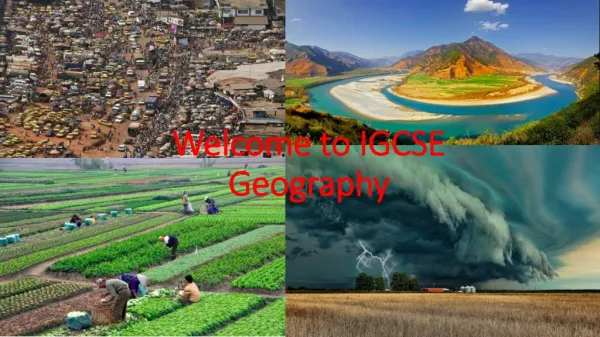
Welcome to IGCSE Geography. Not that good an impression, but close-ish – kinda!. I am Lindy. IGCSE geography is a good course. But in order to do well you will need to do much more than the hour a week we are given in class. To help you with this I have started a wiki specially for you guys

Welcome to IGCSE Geography
E N D
Presentation Transcript
Welcome to IGCSE Geography Not that good an impression, but close-ish – kinda! I am Lindy
IGCSE geography is a good course • But in order to do well you will need to do much more than the hour a week we are given in class. • To help you with this I have started a wiki specially for you guys • There will be • copies of all the files we use in class and homework. • together with other links that I hope will be helpful
The wiki is called • Ysgol Rhyngrwyd IGCSE Geography • [the reason for that you can find on the site!] • The link is • http://ysgol-rhyngrwyd-igcse.wikispaces.com/ • I have also started a blog for the school, where I put new items that might be of interest and/or help you with your lessons called ‘Coach House geography’ and is found at • http://lindym.wordpress.com/
Every week • I will email you ( and store on the site) a worksheet for class time. • You will use it to scribble on so print it off before class – I never need see it, but you will find it useful when it comes to homework/revision to have some notes made. Start a file for these to be kept in. • If you really cannot get it printed off for whatever reason, I suggest you keep it open on your desktop during class.
Because geography is quite graphics intensive • I tend to have several short topics each lesson • Each of these will have some homework associated with them – it might be a simple quiz • Or it might be something a bit more complicated. • But keeping up to date with homework is ESSENTIAL if you are to get a good grade next year.
The Course • Unit 1 People and the natural environment • Unit 1A: Water • Unit 1B: Hazards • Unit 2 People and work • Unit 2A: Production • Unit 2B: Development • Unit 3 People and places • Unit 3A: Migration • Unit 3B: Urban environments • Unit 4 Global issues • Unit 4A: Fragile environments • Unit 4B: Globalisation • Unit 4C: Human Welfare
Geography IGCSE Lesson 1
What is happening here? 1. What do the yellow wiggly lines from the sun with No 1 attached indicate? 2.What about the blue wiggly lines from the sea show with No 2? 3. What is happening at No3? 4. And No 4? 5. Now No 5 is in 2 places – it is a very much simplified version of what happens – what is it trying to show? 6. Where does all this water eventually end up? Now lets try and fill in some of the gaps – this one is far too simple! Diagram
But is the ocean the only place where water evaporates from? Where else? Now the original simple version implied that the sun warmed the ocean which caused some of the sea water to evaporate, rise, condense to become clouds. Diagram
So where have we got to? • Water evaporates mostly from the ocean, but also from rivers, lakes, the soil and from plants. • This due to energy from the sun warming the water in all these places, allowing it to turn into water vapour. • As it is warm, the water vapour rises into the air. • As it gets higher, it cools. • Cool air can hold less water vapour than warm air and so some condenses to form clouds. • As more tiny drops of water from, they join, getting heavier all the time. • Eventually they are heavy enough to be pulled back to earth as precipitation in some form, and depending on the conditions they fall as rain, hail, sleet or snow.
This where we have got to So once the rain has fallen, the water can stay where it is or move. If it is going to stay where it is, where might this be?
If it stays where it is … • It could catch on the leaves and branches of the plants – we say the water has been intercepted • It could fall into lakes and rivers • Puddles could form on the surface. These are all fresh water surface storage • Some more snow may fall on the icecap or glacier – this is glacial storage • All these are called stores • There are another couple of stores as well for later
This where we have got to If the water is going to move, how might this happen?
If it moves … • It could run down a slope – surface run-off • It could drop into the river and be carried away • It could drip off the trees onto the ground • It could soak into the soil – this is called infiltration • If it goes even further down into the spaces between a permeable rock, this is called percolation. • All these are called flows
There are 2 flows and one intrusion (another flow), and 3 storages that we have not talked about? Also what is the blue dotted line for? This is the whole thing Fresh water storage Salt water storage Ground water storage Water table
So summing up …. • The missing terms were: • Fresh surface water storage – in lakes and reservoirs • Subsurface flow (or sometimes through flow) – we have lots of that – out every bank in wet weather little springs give evidence of it • Ground water flow – this is water that flows over the top of the water table as there is no more spaces left to fill • Salt water intrusion – comes in from the sea – ever dug a castle on the beach and had water filling the hole – taste it and you would find that is salt water intrusion • Ground water storage is the water stored in the water table that can stay there for 1000s of years – more about bore holes another time! • The water table is the top layer of rock below which all the cracks and crevices in the permeable rock is filled
Homework on this topic • Download the sheet for homework • Visit as many of the games as you like as often as you like. • Once you feel happy with it, go for the HotPotatoes quiz – this records marks, times and what you answered – it is against the clock so do not go there until you know your stuff! By the way there is nothing to stop you doing the quiz more than once – after all getting it wrong to start with and right later means you have learnt something. And that is good – your best mark is your recorded one!
As you see the watershed is the line that defines the limits of the drainage basin. Any water that lands within its limits (green arrows) will run off or infiltrate and most will eventually end up in the river channel. Any water falling on the other side of the watershed (red arrows) will end up in another drainage basin River Channel
More thoughts • What is the difference between a tributary and a confluence? • A source and a mouth? • A river basin and a river channel? • Remember we said the hydrological system was a closed system? What did that mean? • Do you think a drainage basin is an open or closed system? Why?
More thoughts • What do you think might make the flow through one drainage basin quicker or slower than another one? • Why do we might we need to know whether a river basin has a fast flow through or not? • What might help us find out which river system is likely to cause a problem and which isn’t? What would we have to measure? • http://techalive.mtu.edu/meec/demo/Watershed.html – a great animation of a drainage basin • HOMEWORK another HotPotatoes quiz!
So …. • We were working our way toward the idea that flooding is one of the problems within in river basins • I hope we also got to the idea that we would need to link rainfall with how much water and how quickly the water reaches the river. • And that this was to an extent dependent on some of the features of the river basin – the things that make the run-off slower or faster • We have a geographical technique that can show how the rainfall and amount of water in river channels – or even outside of the river channel if the rainfall is very heavy – can be linked.
So …. • If we measure the rainfall and put it on a time graph and link that to the amount of water in the river, we have some really useful information! • This graph is hydrograph. It plots rainfall against discharge (that is the amount of water in the river as it passes a particular point measured in cubic metres per seconds or cumecs). • Changes measured over time is river regime - eg in winter more rain, less evaporation, less vegetation to absorb it.
This what a hydrograph looks like Often you will have mm for rain on the left vertical axes and cumecs on the right vertical axis
Words & Ideas • Lag time: peak discharge – peak rainfall • The angle of the rising limb (the line from Normal or base flow up to peak flow) is very dependent on how quickly the water in the river rises. • The peak flow depends on how much of the rainfall actually ends up in the river – does some evaporate or does it soak into the ground or does it all run straight down the slope into the river?
Variations in discharge: • How would climate affect lag time? Discharge? • How would vegetation (or lack of it) affect lag time? Discharge? • How would steepness (or lack of it) affect lag time? Discharge? • How would rock type affect lag time? Discharge? • How the size of the drainage basin affect lag time? Discharge? • How would urbanisation affect lag time? Discharge? • How might abstraction/ dams affect discharge?
Variations in discharge - summary • Climate (amount/intensity of rain influence lag time); • Lots of trees/vegetation increase intercept, slow lag time – bare ground speeds it up • Relief – steep slopes increase speed of run-off • Flat land: water infiltrates soil, less run-off • Rock type – impermeable run-off, permeable infiltrate • large drainage basin takes longer • Tarmac speeds up run-off • Abstraction/ dams affect discharge
Here are 4 hydrographs, each with outputs from 2 different conditions on them. • We will look at them one at a time, notice the differences in the graph and then decide which is which!
These 2 are different because they have different sized drainage basins – one small and one large Recall that the blue graph on the lower left is telling you how many mm of rainfall fell in the area First of all, how are the 2 graphs different from one another? Now which is the large basin and which is the small one? Explain Graph A
These 2 different types of ground cover in their basins – one is mostly bare earth, while the other well forested First of all, how are the 2 graphs different from one another? Now which is the bare earth basin and which is forested. Explain. Graph B
These 2 different shapes of basin – one has gently sloping sides and the other is very steep sided. First of all, how are the 2 graphs different from one another? Now which is gently sloping and which is steep sided? Explain. Graph C
These 2 basins have different kinds of rock. One of them has permeable rock while the other has impermeable rock. Do you know the difference? First of all, how are the 2 graphs different from one another? Now which has permeable rock and which has impermeable rock? Explain. Graph D
Homework • There is a blank graph in word. • It has some data for you to fill in and some labels round it for you to draw lines to the points on the graph. • Instructions are on the sheet as to how to do it on your computers