Download

1 / 50
780 likes | 2.31k Vues
CHAPTER 16: POPULATION, URBANIZATION, AND THE ENVIRONMENT. POPULATION DYNAMICS. 1. Demography —the scientific study of human populations Demography examines size, composition, distribution, and the changes and causes of these characteristics. Population Dynamics. 1.

E N D
POPULATION DYNAMICS 1 Demography—the scientific study of human populations Demography examines size, composition, distribution, and the changes and causes of these characteristics
Population Dynamics 1 Population—a collection of people who share a geographic territory Populations vary in size from a small town to the planet.
The World's Population 1 The global population has grown rapidly since 1750. It reached 1 billion in 1804, 6.5 billion by 2005, and is expected to reach 9.4 billion by 2050.
The World’s Population 1 Fertility—the number of babies born in a particular society Crude birth rate—the number of live births per 1,000 population in a given year In 2008, the CBR was 21 worldwide, 37 for Africa, and 14 for the U.S.
The World’s Population 1 Birth rates vary within a country. In the U.S., birth rates are higher for younger women, recent immigrants, and those with low income and education levels.
Discussion 1 Why are birth rates higher for some populations than others?
The World’s Population 1 Mortality—the number of deaths in a population Crude death rate—the number of deaths per 1,000 people in a population in a given year In 2008, the crude death rate worldwide was 8.
The World’s Population 1 Infant mortality rate—the number of deaths among infants under 1 year of age per 1,000 live births In 2008 infant mortality was 49 for the world, 6.5 for the U.S., and 163 for Afghanistan.
The World’s Population 1 Life expectancy—the average number of years that people who were born at the same time will live. In 2008, worldwide the average life expectancy was 68. The U.S. had a life expectancy of 78, below at least 25 other developed countries.
Discussion 1 What causes the differences in life expectancy and mortality rates?
The World’s Population 1 • Migration—the movement of people into or out of a specific geographic area • Push factors encourage or force people to leave a residence. Examples are war, religious persecution, or unemployment. • Pull factors attract people to a new location. Examples are employment opportunities, religious freedom, and lower crime rates.
The World’s Population 1 • International migration—the movement across a national border • Emigrants move out of a country. • Immigrants move into a country. • Internal migration—movement within a country
Application • Identify the type of migration and push or pull factors. • Martha's family moved from Mexico to Texas for better employment opportunities. • A family moved from Afghanistan to the U.S. to escape war. • A young man moved from Montana to Seattle to pursue an interest in music.
Population Composition and Structure 1 • Sex ratio—the proportion of men to women in a group • 100—equal numbers of men and women • 95—fewer males than females • 105—fewer females than males
Discussion 1 What causes the sex ratio to be different for different populations? What effects do different sex ratios have?
1 Population pyramid—a visual representation of the age and sex structure of a population at a given point in time Population pyramids allow demographers to predict future needs of a population. For example, an aging population will require more long-term health care.
Population Growth 1 Malthusian theory—the belief that the population is growing faster than the food supply needed to sustain it. Thomas Malthus, in 1798, maintained that population grows at a geometric rate while food grows at an arithmetic rate. Population will out distance food supply.
Population Growth 1 Prevention checks include war, famine, disease, and moral restraint. Neo-Mathusians agree that the world population is exploding beyond food supplies. Earth has become a dying planet with increasing population and pollution.
Population Growth 1 Demographic transition theory maintains that population growth is kept in check and stabilizes as countries experience economic development. Population growth changes as societies undergo industrialization, modernization, technological advancements, and urbanization.
Population Growth 1 • A nation goes through 4 stages: • Stage 1: Preindustrial societies with high birth rates and high death rates • Stage 2: Early industrialization with significant population growth because of high birth rates but lower death rates
Population Growth 1 • Stage 3: Advanced industrialization with lower birth rates and death rates and a lower population growth rate • Stage 4: Postindustrial societies with low births and low death rates and population growth stability or even decrease.
Population Growth 1 Many nations are experiencing zero population growth. Each woman has no more than two children resulting in a stable population.
Discussion 1 Which is correct, Malthusian theory or demographic transition theory?
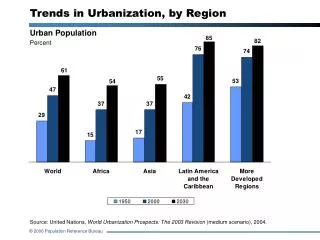
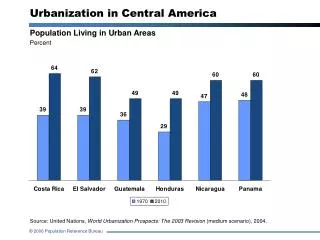
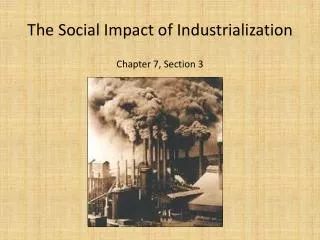
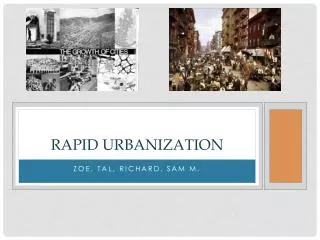
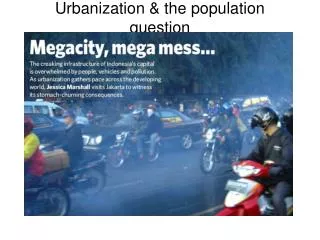
URBANIZATION 2 Urbanization is the movement of people from rural areas to cities. In 2008, for the first time in history, a majority of the world's population lived in urban areas. The Industrial Revolution created a surge in urbanization as people moved to cities in search of jobs and improved living conditions.
Urbanization 2 Megacities, metropolitan areas with at least 10 million inhabitants, are becoming more common. The U.S. has two megacities, New York-Newark and Los Angeles.
Urbanization in the U.S. 2 Eighty-five percent of the counties losing population in recent years are rural. Fastest growing counties are just outside of urban areas. Suburbanization—movement from cities to the areas surrounding them. Today more than 60% of Americans reside in suburbs.
Consequences of Urbanization 2 Urban sprawl—the rapid, unplanned, and uncontrolled spread of urban development into neighboring regions Urban sprawl results in loss of farmland, wildlife habitats, forests, and open recreational areas.
Consequences of Urbanization 2 The use of automobiles has increased along with the cost of purchasing and maintaining them and resultant air pollution.
Consequences of Urbanization 2 Gentrification—the process of buying and renovating houses and stores by middle-class and affluent people in downtown urban neighborhoods Gentrification revitalizes urban areas and augments taxes but results in displacement of low-income people and small business.
Consequences of Urbanization 2 Racial segregation continues to exist in cities. As the suburbs expanded, low-income African Americans were left in the central cities with few housing and employment choices.
Sociological Explanations of Urbanization 2 Functionalists developed theories of urban ecology—the study of the relationships between people and their urban environment. Theories analyzed the growth of cities into different patterns, such as concentric zones, as residents' needs were met.
Sociological Explanations of Urbanization 2 The new urban sociology has been heavily influenced by conflict theory. Economic and political factors determine urban growth or decline. Urban changes are influenced by the dominant social class and powerful capitalists.
Sociological Explanations of Urbanization 2 Feminist scholars emphasize gender-related constraints caused by capitalism. Poor women and minorities have the least access to decent housing. Safe public transportation and other public areas are limited. Many women fear for their physical safety.
Sociological Explanations of Urbanization 2 Symbolic interactionists are interested in the impact of urban life on its residents. Urbanism is a way of life characterized by tolerance of different lifestyles but superficial interaction and social isolation.
Application • Identify the theoretical perspective: functional, conflict, feminist, interactional. • People create suburbs to enhance their quality of life. • Financial institutions determine the shape of cities. • Urbanites are more socially isolated than those in rural areas.
Discussion 2 What aspects of city life are beneficial to the residents? What aspects of city life are problems for the residents?
ENVIRONMENTAL ISSUES 3 An ecosystem involves a physical environment and all forms of life living in relation to one another.
Access to Clean Water 3 • Worldwide • More than 1 billion people do not have clean water. • Almost 6 billion do not have adequate sanitation. • Almost 2 million children die every year because of contaminated water. • Water-related diseases are the single largest cause of sickness and death.
Threats to the Water Supply 3 • Pollution • More than half of the world's rivers are polluted by untreated sewage and industrial waste. • Human activities account for about 40 percent of the highly toxic mercury emissions in the U.S.
Threats to the Water Supply 3 • Privatization • Transferring some or all of the assets or operations of public water systems into private hands • Bottled water contributes to greenhouse gases, depletion of local water sources, and plastic bottle waste.
Threats to the Water Supply 3 • Mismanagement • Most water-related problems are due to human mismanagement, corruption, and bureaucratic bungling. • The Clean Water Act is rarely enforced. • Many water and sewage pipes are old and deteriorating.
Air Pollution and Global Warming 3 • The most common sources of air pollution are: • Fossil fuels • Factories • Winds blowing contaminants to other countries • Government policies including lack of enforcement of pollution law
Air Pollution and Global Warming 3 The greenhouse effect—a rise in the earth's temperature due to atmospheric gases that allow the sun's light to enter but traps the heat Global warming—increased temperature of the earth's atmosphere caused, in part, by human activities
Air Pollution and Global Warming 3 Global warming results in rising sea levels and intense droughts, floods, and storms.
Sustainable Development 3 Sustainable development refers to economic activities that meet the needs of the present without threatening the environmental legacy of future generations.
Discussion 3 Should we be optimistic or pessimistic about the environmental future? What should be done about our environmental future?
Internet Connections • How do people understand what goes on in cities? What types of communications take place in public spaces? These are a few of the questions that the Urban Archives group at the University of Washington is interested in exploring. Comprised of a broad range of individuals, the Urban Archives group hopes "to create a conversation between scholars, artists and activists interested in a variety of issues related to communication in public spaces." In the Digital Collections area, visitors can look at yard art, electric signs, graffiti, windows, and ghost signs—fading advertisement images and murals. The group’s weblog seeks to document changes in the urban landscape of Seattle, and it does a good job through its thoughtful posts and accompanying images. For more information, visit: http://www.urbanarchives.org
Internet Connections • Over the past several decades, the European Union has grown increasingly concerned about the ever-growing amount of trash and other assorted rubbish across Europe. Ever year, E.U. countries throw away approximately 1.3 billion metric tons of waste, along with approximately 700 million metric tons of agricultural waste. With that in mind, they established a unified approach to waste management and disposal. Europa: Environment and Waste provides both information on this approach and details about related matters, including the dismantling of ships, sewage treatment, and the incineration of waste. After reading the brief introduction on the homepage, visitors can look over the thematic list of topics along the left-hand side of this page. In each area, visitors can read about various activities, including proposed legislation, working papers, and scientific reports. Two sections which should not be overlooked include the "Sustainable Use of Natural Resources" and the "Integrated Product Policy" areas. For more information, visit: http://ec.europa.eu/environment/waste/index.htm