Download
1 / 26
280 likes | 445 Vues
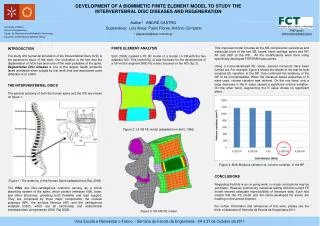
This paper explores the impact of clamping in Wire and Arc Additive Manufacturing (WAAM) through a 3D finite element analysis. It investigates the deformation and residual stress distribution, focusing on corner clamping's effects. Utilizing a verified model, the study delves into stress components analysis and effective stress distribution to understand the behavior. The simulation process involves a detailed investigation of the deposition patterns and thermal results, highlighting the asymmetry profile modeling. By validating results through experiments, the study provides insights into optimizing WAAM processes.

E N D
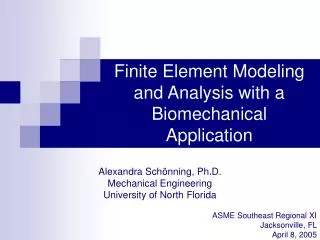
Three-dimensional finite element analysis with clamping in wire and arc additive manufacturing Xiaolong Wang Beijing Institute of Technology Beijing, P.R.China
Introduction Simulation process Conclusions Simulation model Results 3 1 3 3 3 3 2 4 Outline
Introduction Simulation process Conclusions Simulation model Results 3 1 3 3 3 3 2 4 Outline
Introduction-WAAM Wire and arc additive manufacturing (WAAM) is a kind of promising metal directly rapid prototyping technology for rapid manufacturing. Intersecting stiffened panels produced by WAAM. (a) and (b) carbon steel. (c) and (d) aluminium. (e) titanium-stiffened panel. (f) Ti thick wall crossover. (g) Ti residual stress balanced cruciform. (h) Ti intersections including machining.
Introduction-WAAM Using arc as the heat source and metal wire as the raw material, WAAM greatly reduces the cost as well as increases the processing efficiency. However, owing to the surface roughness, it requires the following machining. Machining
Introduction-Simulation The deposition pattern Three dimensional model Many aspects of the WAAM simulation have been investigated. Such as: • Three dimensional transient model has been developed to analyze the distortion and residual stress distributions. • the deposition patterns had significant influences on the deformation and residual stress distribution. • The thermal results have shown that the process is not thermally symmetric, which has significant influence on residual stress.
Introduction-Simulation Stress components analysis Effective residual stress distribution Most studies assume that the substrate is fully fixed, which means there is no deformation of the substrate. However, lots of experiments have shown the obvious deformation during the process, and the clamping is also need to be considered.
Introduction-Our paper • So we focus on the influence of the clamping in WAAM. • In our paper: • A 3D single-pass multi-layer WAAM model with verified weld-bead profile and heat source model is established. • The corner clamping is modeled, which is the most commonly used clamping form. • The deformation and residual stress are investigated to understand the influence behavior of the corner clamping.
Introduction Simulation process Conclusions Simulation model Results 3 1 3 3 3 3 2 4 Outline
Simulation model A 3D single-pass multi-layer WAAM model with temperature dependent material properties is presented using the finite element software Simufact.welding. The corner clamping is modeled. The deformation and residual stress are investigated. To validate the simulation calculated results, the weld-bead profile and heat source model were verified by experiments. Illustration of our three-dimensional finite element model with clamping.
Simulation model To model the asymmetry profile, parabola conventional mathematics function is used. The parabola model function is indicated by The value of the height is 3.13 mm and the width is 11.4 mm, which can be used to calculate the parabola model parameters. (a) (b) Weld-bead profile and welding pool shape. (a) Experimental result. (b) Simulation model.
Simulation model A moving heat source model, namely Goldak double ellipsoidal, is employed in the thermal model. The heat distribution is given as: where qfand qr are heat densities in W/m3 at any spatial point (x, y,z) at any time t inside the front (f) and the rear (r) half-ellipsoids.
Introduction Simulation process Conclusions Simulation model Results 3 3 3 1 3 3 2 4 Outline
Simulation process To compare and analyze the results, four sampling lines are chosen in the longitudinal and transversal direction. • Sampling line 1 and 2 are the central lines. • Line 3 and 4 are the offset lines. • Sampling line 1 and 3 are used to analyze the longitudinal properties, • Sampling line 2 and 4 are investigated the transversal properties. • Sampling line 4 also goes through the component, and the difference between the center and the side of the component can be analyzed. longitudinal direction transversal direction
Simulation process (a) (b) (c) (d) The simulation process with clamping at (a) 1st layer; (b) 2nd layer; (c) 3rd layer; (d) last layer. The component is deposited layer by layer, and the direction of each adjacent layer is opposite.
Introduction Simulation process Conclusions Simulation model Results 3 1 3 3 3 3 2 4 Outline
Results (1) Different regions analysis 1 2 2 • The maximum effective stress distributes at the region near clamping beginning to end. This is because that the clamping limits the deformation of the substrate. • The effective stress distribution along the longitudinal side and the transversal side have a significant difference. The effective stress of the middle point along the transversal side is the side minimum stress, while there is a stress peak in the longitudinal side middle point. • Further analysis shows that this stress peak is formed during cooling time, and is caused by the reduction of distortion, which produces high compressive stress at the upper surface.
Results (2) Total distortion of component (b) 4th layer (a) 1st layer (c) 6th layer (d) After cooling
Results (2) Total distortion of component • Along the longitudinal direction: • The end side distortion of both the sampling line 1 and 3 are near zero. • The middle point distortion is the maximum. • The difference between sampling line 1 and 3 is inconspicuous. • Along the transversal direction: • There are obvious distortion peaks at the middle of two sampling lines, which are the region of the component. • Owing to the large distance of the longitudinal side, sampling line 2 has quite large distortion at the end side and the decreasing tendency to the middle region.
Results (3) Effective residual stress distribution (b) 4th layer (a) 1st layer (c) 6th layer (d) After cooling
Results (3) Effective residual stress distribution • Compared with the sampling line 1 and 3: • The end side residual stress of sampling line 1 is much lower than line 3, because the clamping fixing effect and these region have much higher residual stress. • In the middle region, these two curves show the same trend. • Compared with the sampling line 2 and 4: • The effective residual stress curves show the same trend. • In the region through the component, these two curves have the same decreasing tendency. • According to the longitudinal and transversal analysis, there is no significant relationship between total distortion and residual stress.
Results (4) Stress components analysis (a) longitudinal stress (b) transversal stress
Results (4) Stress components analysis • Here we focus on the region of 6 layers component, which contains the -50 mm to 50 mm region in longitudinal length and -5.3 mm to 5.3 mm region in transversal length. • The transversal stress is much higher than longitudinal stress, and plays a dominant role in the residual stress. • The transversal stresses of component region along the sampling line 1 and 2 are around 100 MPa, and the longitudinal stresses are all small.
Introduction Simulation process Conclusions Simulation model Results 3 3 3 1 3 3 2 4 Outline
Conclusions • Based on the experimental result, the three dimensional model is verified. Simulating welding pool shape is fit for the experimental result. • The commonly used corner clamping is added to the model, and the maximum effective stress distributes are analyzed during the simulation process. • The total distortion is evident. The maximum distortion located at the middle of component, and can reach nearly 6 mm. the longitudinal direction curves have almost the same trend, while the transversal direction curves have obvious difference owing to the corner clamping. • According to the longitudinal and transversal analysis, there is no significant relationship between total distortion and residual stress, while they all have a significant relationship with the clamping form. The transversal stress is much higher than longitudinal stress, and plays a dominant role in the residual stress.
Thanks! Xiaolong Wang wangxl_bit@126.com