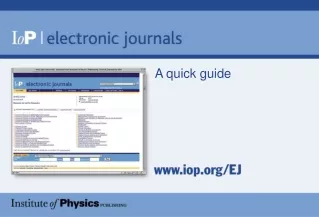

A Quick Guide to Information Visualization
E N D
Presentation Transcript
A Quick Guide to Information Visualization Yingcai Xiao
Visualization Representing data as computer graphics.
Scientific, Engineering and Information Visualization Scientific Visualization: Scientific Data Engineering Visualization: Measurement Data Information Visualization: Abstract Data
Scientific and Engineering Visualization Scientific & Measurement Data are physical data representing physical properties (temperature, pressure, wind speed, tension, …) of the physical world. Scientific Visualization & Engineering Visualization are commonly used to represent the physical world.
Information Visualization Abstract Data are usually non-physical data representing social information in the society: population, traffic, movie rating, … Information Visualization is commonly used to represent social information
Abstract Data Visualization through computer graphics are done in space (screen) and time (animation). We need to study the spatial and temporal characteristics of abstract data.
Spatial Characteristics of Abstract Data Some has location association: population, traffic, … Some don’t have location association: movie rating. Most of them don’t have spatial continuity, therefore, can’t be interpolated.
Temporal Characteristics of Abstract Data Some have temporal continuity: population Some have temporal continuity at certain time scale: traffic flow on a city street with signal lights.
Characteristics of Abstract Data Some are high dimensional: GDP factors. Some are physical data but with characteristics closer to abstract data than most physical data: genomic data.
Challenges of Information Visualization One of the main challenges of Information Visualization is that most abstract data have no spatial continuity, hence, not interpolatible. Some even do not have any spatial association, for example, movie rating.
Data Structures & Algorithms Data Structures: Data tables (database, spreadsheet). Algorithms: Charts, maps, animations, parallel coordinates, application specific methods (collision diagrams).
Charts Take advantage of the fact that most abstract data has no spatial correlation, arrange graphics in any spatial order which makes it easy for users to analyze data values.
Charting Methods Column/Bar, Line/Area, Pie/Doughnut, Treemap/Sunburst, Histogram, Box-Whisker, Scatter/Bubble, Waterfall, Funnel, Stock, Surface, Radar, Combo
Charting Tools Spreadsheet charting tools Capstone Project Evaluation.xlsx Insert->Charts: Column/Bar, Line/Area, Pie/Doughnut, Treemap/Sunburst, Histogram, Box-Whisker, Scatter/Bubble, Waterfall, Funnel, Stock, Surface, Radar, Combo
Charting Tools Online charting tools Google charts: https://google-developers.appspot.com/chart/interactive/docs/gallery http://www.cs.uakron.edu/~xiao/visualization/Vis-PA1-Sai%20Goud-Durgappagari.html API: https://developers.google.com/chart/
Maps Maps are used to display geographical related information: population, traffic, road map, … https://www.gapminder.org/tools/#$chart-type=map GIS: geographical information systems
Mapping Tools https://www.google.com/maps https://cloud.google.com/maps-platform/ https://cloud.google.com/maps-platform/products/ https://cloud.google.com/maps-platform/maps/
Mapping Tools https://www.pitneybowes.com/us/location-intelligence/geographic-information-systems/mapinfo-pro.html https://www.esri.com/en-us
Animation Take advantage of the fact that some abstract data have temporal continuity, animate data with time-sequences of graphics. All charts and maps can be animated.
Animation https://www.youtube.com/results?search_query=gapminder+hans+rosling Sounding of PI https://www.youtube.com/watch?v=wM-x3pUcdeo Music Visualization: Line Riders - Beethoven's 5th https://www.youtube.com/watch?v=vcBn04IyELc
Animation Tools http://www.gapminder.org https://www.gapminder.org/tools/#$chart-type=bubbles https://www.gapminder.org/tools/#$state$time$value=2018;;&chart-type=map https://www.gapminder.org/tools/#$state$time$value=2018;;&chart-type=linechart https://www.gapminder.org/tools/#$state$time$value=2018;;&chart-type=barrank
Animation Tools https://google-developers.appspot.com/chart/interactive/docs/animation
High-dimensional Data Parallel Coordinates
High Dimensional Data High dimensional data can’t be mapped to a 3D or 2D space directly. Professor Alfred Inselberg introduced Parallel Coordinate in 1959.
High Dimensional Data In traditional coordinate systems, axes are perpendicular, a data point is represented as a graphical point (a dot) in the space.
High Dimensional Data In parallel coordinate systems, axes are parallel to each other, a data point is represented as a graphical line (a polyline) in the space.
High Dimensional Data https://syntagmatic.github.io/parallel-coordinates/ Parallel Coordinates in 3D ChrisSuma-Thesis.pdf
Data Source https://toolbox.google.com/datasetsearch https://www.census.gov/data.html https://www.nlm.nih.gov/NIHbmic/nih_data_sharing_repositories.html https://www.gapminder.org/data/ (over 500 data sets with visualization)
Data Source https://datastudio.google.com/data https://datastudio.google.com/u/0/datasources/create
NIH Data https://www.nlm.nih.gov/NIHbmic/nih_data_sharing_repositories.html Visible Human Project https://en.wikipedia.org/wiki/Visible_Human_Project
Listing http://www.visualisingdata.com/resources/
Google Tools & APIs http://www.visualisingdata.com/resources/ https://datastudio.google.com https://datastudio.google.com/u/0/navigation/reporting https://developers.google.com/chart/interactive/docs/reference https://www.gapminder.org/downloads/
Census Data Tools https://www.census.gov/library/visualizations.html https://www.census.gov/data/developers/data-sets/Geocoding-services.html https://www.census.gov/data/data-tools.html https://www.census.gov/data/developers/updates/new-discovery-tool.html
Bokeh API https://bokeh.pydata.org/en/latest/ “Bokeh is an interactive visualization library that targets modern web browsers for presentation. It is good for: Interactive visualization in modern browsers Standalone HTML documents, or server-backed apps Expressive and versatile graphics Large, dynamic or streaming data Easy usage from python (or Scala, or R, or...) No JS required
Bokeh API https://bokeh.pydata.org/en/latest/docs/gallery.html#gallery https://hub.mybinder.org/user/bokeh-bokeh-notebooks-ojxfsz2d/notebooks/tutorial/00%20-%20Introduction%20and%20Setup.ipynb https://bokeh.pydata.org/en/latest/docs/dev_guide.html#devguide https://bokeh.pydata.org/en/latest/docs/user_guide.html
Parallel Coordinate Apps & APIs Xdat.org https://syntagmatic.github.io/parallel-coordinates/
Other Info Vis Apps & APIs https://plot.ly/ https://towardsdatascience.com/jupyter-superpower-interactive-visualization-combo-with-python-ffc0adb37b7b https://www.tableau.com/trial/data-visualization https://hackernoon.com/taking-data-visualization-to-another-level-4d1c47bb01a2 https://www.sisense.com/blog/d3-visualization-dashboards/ https://www.govtech.com/data/Visualization-Takes-Open-Data-to-the-Next-Level.html https://towardsdatascience.com/the-next-level-of-data-visualization-in-python-dd6e99039d5e https://collab365.community/take-power-bi-visualization-next-level/ https://www.youtube.com/watch?v=_tYs7SDQikE
Info Vis Examples http://www.visualisingdata.com/2016/03/little-visualisation-design/ http://www.gapminder.org https://towardsdatascience.com/data-visualization/home https://plot.ly/ http://www.visualisingdata.com/2018/06/best-visualisation-web-march-2018/ https://towardsdatascience.com/visualize-programming-language-popularity-using-tiobeindexpy-f82c5a96400d https://flowingdata.com/ https://www.tiobe.com/tiobe-index/
Summary • Information Visualization • Abstract Data • Spatial and Temporal Characteristics • Visualization Methods • Data Sources • Programming APIs