Download
1 / 27
270 likes | 295 Vues
County SNAPSHOT. Grand Traverse County, MI. 01. 02. 03. 04. 05. Overview. Demography. Human capital. Labor force. Industry and occupation. Table of contents. 01 overview. Grand Traverse County, MI. Lakes to Land Regional Initiative Region. Overview.

E N D
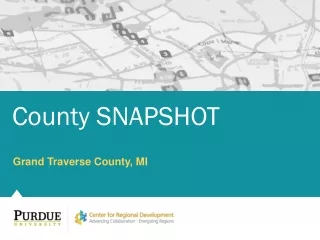
County SNAPSHOT Grand Traverse County, MI
01 02 03 04 05 Overview Demography Human capital Labor force Industry and occupation Table of contents
01 • overview Grand Traverse County, MI
Lakes to Land Regional Initiative Region Overview • Grand Traverse county is a part of the Lakes to Land Regional Initiative Region. • This region is comprised of four Michigan counties. U.S. 31 passes through the western part of the region and connects to I-75 located at the eastern edge of the region. • Benzie • Grand Traverse • Kalkaska • Manistee section 01
02 • demography • Population change • Age structure • Income and poverty
Total population projections Population change 9.7% 4.4% Grand Traverse County 99,600 Demography 12.0% 4.2% -0.1% 4.1% 90,782 86,986 61,800 Rest of LLRI Region 59,333 59,411 77,654 57,096 2014-2020 2000-2010 2010-2014 2000 section 02 • Source: 2000 & 2010 Census, 2014 Population Estimates, and 2020 Population Projection by http://www.michigan.gov/documents/8510_26104_7.pdf
Demography Ethnicity Race 2000 Hispanics - 2000 Hispanics - 2014 2014 2.7% section 02 • Race Data Source: U.S. Census Bureau – 2000 Decennial Census and 2014 Annual Population Estimates
Demography Population Age Structure, 2000 A visual presentation of the age distribution of the population(in percent) section 02 • Source: 2000 Decennial Census, U.S. Census Bureau
Demography Population Age Structure, 2014 A visual presentation of the age distribution of the population(in percent) section 02 • Source: 2014 Population Estimates, U.S. Census Bureau
Demography Income and poverty section 02 * Note: Regional Median Household income is the population-weighted average of median household income values across the EIRPC Region counties. Source: U.S. Census Bureau – Small Area Income and Poverty Estimates (SAIPE)
03 • human capital • Educational attainment • Graduation rates • Patents
Educational attainment, 2013 Human capital Grand Traverse County Rest of LLRI Region Some high school No high school Associate’s degree Bachelor’s degree Graduate degree High school diploma Some college section 03 • Source: 2009-2013 American Community Survey 5-Year Estimates
Patents Human capital Patents per 10,000 Jobs 2001-2013 From 2001 to 2013, Grand Traverse county was issued patents at a rate of 2.09 per 10,000 jobs, while the remaining counties in LLRI region garnered 1.71 patents per 10,000 jobs. Patenting trends are an important indicator of the level of innovation in a region. Commercializing this innovation can lead to long-term growth for regional economies. Patents per 10,000 residents 2001-2013 From 2001 to 2013, 1.60 patents per 10,000 residents were issued in Grand Traverse county. The rest of LLRI region amassed 0.72 patents per 10,000 residents. section 03 • Source: U.S. Patent and Trademark Office, Census, BEA, and EMSI • *Note: Patent origin is determined by the residence of the first-named inventor. Since a number of workers commute into the region, the number of patents produced in the CUPPAD Region could be high. However, among residents of the region, patent production is relatively low.
04 • labor force • Unemployment rates • Earnings per worker • Source of labor for the region
Unemployment rates Labor force Rest of LLRI Region Grand Traverse County section 04 • Source: LAUS, BLS
Earnings per worker in 2014 Labor force Grand Traverse County Rest of LLRI Region Average earnings section 04 • Source: EMSI Class of Worker 2014.4 (QCEW, non-QCEW, self-employed and extended proprietors)
Journey to Work: Grand Traverse County Labor force Out-Commuters In-Commuters Same Work/ Home 25,051 18,537 9,950 section 04 • Source: LEHD, OTM, U.S. Census Bureau
05 • industry • and occupation • Establishments • Employment by industry • Cluster analysis • Top occupations • STEM occupations
Industry and occupation Establishments: Grand Traverse County • An establishment is a physical business location. • Branches, standalones • and headquarters are all considered types of establishments. Definition of Company Stages 0 1 Self-employed 2-9 employees • 3 10-99 employees 100-499 employees 4 500+ employees section 05 • Source: National Establishment Time Series (NETS) – 2011 Database
Industry and occupation Establishments section 05 • Source: National Establishment Time Series (NETS) – 2011 Database
Industry and occupation Establishments section 05 • Source: National Establishment Time Series (NETS) – 2011 Database
Industry and occupation Top ten industry sector employment growth:Grand Traverse County section 05 • Source: EMSI Class of Worker 2014.4 (QCEW, non-QCEW, self-employed and extended proprietors)
Industry and occupation Top six industry sector employment decline:Grand Traverse County section 05 • Source: EMSI Class of Worker 2014.4 (QCEW, non-QCEW, self-employed and extended proprietors)
Top five occupations in 2014: Grand Traverse County Industry and occupation section 05 • Source: EMSI Class of Worker 2014.4 (QCEW, non-QCEW, self-employed and extended proprietors)
Science, Technology, Engineering & Math 1,372 1,323 Industry and occupation 3.7% 426 418 Grand Traverse County -1.9% Rest of LLRI Region 2009 2014 Change Job change in STEM occupations section 05 • *Note: STEM and STEM-related occupation definitions from BLS (2010) • Source: EMSI Class of Worker 2014.4 (QCEW, non-QCEW, self-employed and extended proprietors)
Report ContributorsThis report was prepared by the Purdue Center for Regional Development, in partnership with the Southern Rural Development Center and USDA Rural Development, in support of the Stronger Economies Together program. Report Authors Bo Beaulieu, PhD Indraneel Kumar, PhD Andrey Zhalnin, PhD Data Analysis Ayoung Kim Francisco Scott Report Design Tyler Wright This report was supported, in part, by grant from the USDA Rural Development through the auspices of the Southern Rural Development Center. It was produced in support of the Stronger Economies Together (SET) program.
For more information, • please contact: • Dr. Bo Beaulieu, • PCRD Director: • ljb@purdue.edu • Or • 765-494-7273 The Purdue Center for Regional Development (PCRD) seeks to pioneer new ideas and strategies that contribute to regional collaboration, innovation and prosperity. December 2015