Download
1 / 33
330 likes | 474 Vues
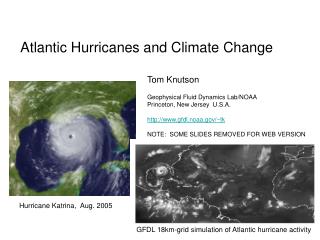
Atlantic Hurricanes and Climate Change. Tom Knutson Geophysical Fluid Dynamics Lab/NOAA Princeton, New Jersey U.S.A. http://www.gfdl.noaa.gov/~tk NOTE: SOME SLIDES REMOVED FOR WEB VERSION. Hurricane Katrina, Aug. 2005. GFDL 18km-grid simulation of Atlantic hurricane activity.

E N D
Atlantic Hurricanes and Climate Change Tom Knutson Geophysical Fluid Dynamics Lab/NOAA Princeton, New Jersey U.S.A. http://www.gfdl.noaa.gov/~tk NOTE: SOME SLIDES REMOVED FOR WEB VERSION Hurricane Katrina, Aug. 2005 GFDL 18km-grid simulation of Atlantic hurricane activity
Focus questions for this talk • Are there significant trends in Atlantic tropical cyclone activity? • How well can we simulate past Atlantic hurricane activity? • What are the prospects for future Atlantic hurricane activity?
The earth’s surface temperature has been increasing…. …but what about hurricanes? Sources: NASA/GISS.
There is some recent evidence that overall Atlantic hurricane activity may have increased since in the 1950s and 60s in association with increasing sea surface temperatures… PDI is proportional to the time integral of the cube of the surface wind speeds accumulated across all storms over their entire life cycles. Source: Kerry Emanuel, MIT, personal communication 2007.
But a measure of annual U.S. landfalling hurricane activity shows no clear long-term trend since 1900… Source: Chris Landsea, NOAA/NHC
The frequency of recorded storms (low-pass filtered) in the Atlantic basin is well-correlated with tropical Atlantic SSTs Source: Emanuel (2006); Mann and Emanuel (2006)
Statistical significance testing • Method 1: Linear least-squares regression on annual storm count series. Adjust degrees of freedom for two-sided t-test based on lag-1 autocorrelation. • Method 2: Same as Method 1, but for the ranks rather than the original series. Addresses issue of skewness in storm count annual data. • Method 3: Bootstrap resampling (with replacement) of series sug-segments of length L. Compute linear trends of resampled data sets as a control comparison. L values in range of 2-8 tested. (Recommended value of 2-3 based on Wilks text.) • The three methods give roughly similar results here.
…but some storms may have been missed and not recorded in the database. Pre-satellite era- 77% strike land Source: Chris Landsea, NHC/NOAA Source: Chris Landsea, NOAA/NHC
Landsea: No significant trend from AMO warm phase to warm phase, or cold phase to cold phase.
Reconstructing past tropical cyclone counts • Satellite-era (1965-2006) storm tracks assumed perfect. • Apply satellite-era storm tracks to documented ship tracks (ICOADS). • Storm detected if ship within radius of tropical storm force winds (17 m/s). First detection must occur equatorward of 40N. Monte Carlo simulation, varying storm radii within reasonable bounds. • All land assumed to be “perfect detector” of tropical storms (equatorward of 40N)—planned to further test… • Assume all relevant ship tracks are in data base—plan to further test with additional tracks. (First will look for evidence of storms in “new” ship data.)
Trend from 1878-2006: Not significant (p=0.05, 2-sided tests) Trend from 1900-2006: Significant “ “
The Atlantic Multidecadal Oscillation (AMO) and Tropical Atlantic (Aug-Oct) SSTs GFDL Model: All Forcings (n=8) GFDL Model: Natural Forcings Only (n=4) GFDL Model: Anthropogenic Forcings (n=4) Note: No indirect aerosol forcing is included in any of these runs. Sources: C. Landsea, NHC/NOAA update of Goldenberg et al. 2000; Knutson and Tuleya (2006; accepted for publication, Cambridge Univ. Press).
A comparison of several climate change metrics: Global Mean Temperature Tropical Atlantic Sea Surface Temperature Atlantic Tropical Storm Counts (unadj.) Atlantic Trop. Storm Counts (Vecchi/Knut. Adj.) U.S. Landfalling Tropical Storms (unadj.) U.S. Landfalling Hurricanes (unadj.) Note: All time series are low-pass filtered (5-yr mean) and normalized to unit standard deviation (y-axis tic marks: 1 st. dev).
Sea surface temperatures have increased in the region where Atlantic hurricanes form and intensify, and they are projected to increase much more during the 21st century…
NW Pacific Basin: Intensity vs. SST Minimum surface pressure (mb) The most intense storms occur at high SSTs Sea surface temperature (deg C) Source: Baik and Paek, J. Meteor. Soc. Japan (1998). Used with permission.
Hurricane models project increasing hurricane intensities and rainfall rates with climate warming … Hurricane Intensity Hurricane Rainfall Rates Current climate Current climate ~Late 21st century ~Late 21st century 6-hr accumulated rainfall [cm] within ~100 km of storm center. Sensitivity: ~12% increase in near-storm rainfall per oC SST increase Sensitivity: ~4% increase in wind speed per oC SST increase Sources: Knutson and Tuleya, J. Climate, 2004 (left); Knutson and Tuleya, 2007; accepted for publication, Cambridge Univ Press (right). See also Bengtsson et al. (Tellus 2007) and Oouchi et (J. Meteor. Soc. Japan, 2006).
Late 21st Century projections: increased vertical wind shear may lead to fewer Atlantic hurricanes 7 6 5 4 3 2 1 0 1 2 3 4 5 6 7 Percent change in shear per degree Celsius global warming Source: Vecchi and Soden (Geophysical Research Letters 2007)
21st Century Atlantic Hurricane Activity? • Models indicate increased hurricane intensities with warmer ocean temperatures. • Climate models project that greenhouse warming may be accompanied by increased vertical wind shear in some regions of the Atlantic, which should act to reduce storm frequency and intensification in those regions. • How do we assess which of these competing effects will “win out”?
GFDL Zetac Model: A new high-resolution regional model for Atlantic hurricane season simulations… • The model runs for entire hurricane seasons. • The model generates its own sample of hurricanes during each season. • These experiments push the limits of available computing resources.
Sample hurricane from the Zetac 18-km grid model Surface winds (m/s) and rainfall (mm/day) Atmospheric “warm core” and wind speeds
The model captures both the increase in hurricane activity since the 1980s and the year-by-year fluctuations…. North Atlantic Basin (August-October) Hurricane Frequency Correlations vs. Obs: Model1: 0.76 Model2: 0.76 Note: Model uses large-scale interior nudging to NCEP Reanalysis Source: Knutson et al. 2007 (in review)
The model captures both the increase in hurricane activity since the 1980s and the year-by-year fluctuations…. North Atlantic Basin (August-October) Hurricane Frequency Correlation: 0.86 Note: Model uses large-scale interior nudging to NCEP Reanalysis Source: Knutson et al. 2007 (BAMS, in press)
The model captures both the increase in tropical storm activity since the 1980s and the year-by-year fluctuations…. North Atlantic Basin (August-October) Tropical Storm Frequency Correlation: 0.74 Note: Model uses large-scale interior nudging to NCEP Reanalysis Source: Knutson et al. 2007 (BAMS, in press)
Correlations: Model1: 0.36 Model2: 0.51 Ensem: 0.57 Correlations: Model1: 0.30 Model2: 0.32 Ensem: 0.41
Correlations: Model1: 0.72 Model2: 0.66 Ensem: 0.76 Correlations: Model1: 0.64 Model2: 0.54 Ensem: 0.70 Correlations: Model1: 0.70 Model2: 0.60 Ensem: 0.72 Correlations: Model1: -0.01 Model2: 0.20 Ensem: 0.13
The Zetac model reproduces the observed reduction of N. Atlantic activity during El Nino events fairly well…
Conclusions • Observed data give conflicting indications on whether humans might have caused significant increases in Atlantic tropical storm and hurricane numbers. • Data quality issues reduce confidence in current assessments and statistical analyses of past Atlantic (and global) hurricane activity. Statistical techniques will be important both for addressing data quality issues and for assessing significance of trends and other features in the data. • Models project increased intensities of the most intense hurricanes and increased hurricane rainfall rates for the late 21st century. • A new regional dynamical downscaling model reproduces the interannual and decadal scale variability of Atlantic hurricane activity during 1980-2006, and shows promise as a tool for exploring the causes of these changes and the possible future changes in Atlantic hurricane activity associated with 21st century climate warming.