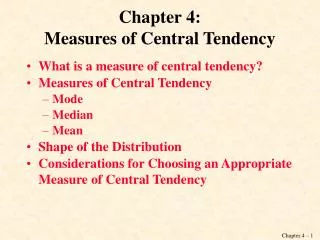
Chapter 4: Central Tendency
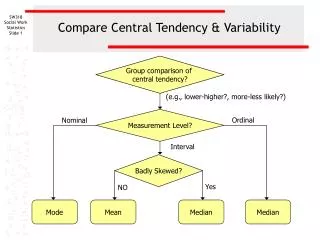
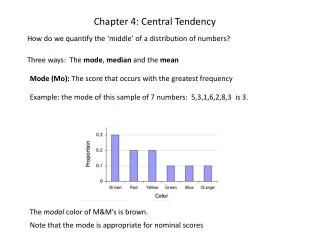
Chapter 4: Central Tendency. How do we quantify the ‘middle’ of a distribution of numbers?. Three ways: The mode , median and the mean. Mode (Mo): The score that occurs with the greatest frequency. Example: the mode of this sample of 7 numbers: 5,3,1,6,2,8,3 is 3.

Chapter 4: Central Tendency
E N D
Presentation Transcript
Chapter 4: Central Tendency How do we quantify the ‘middle’ of a distribution of numbers? Three ways: The mode, median and the mean Mode (Mo): The score that occurs with the greatest frequency Example: the mode of this sample of 7 numbers: 5,3,1,6,2,8,3 is 3. The modal color of M&M’s is brown. Note that the mode is appropriate for nominal scores
Median (Mdn): The value that divides the distribution into halves. Same as P50 We calculate the median by calculating P50. Rank order Score Subtract 1/2 Divide by 23 Multiply by 100 The percentile score for P50 is 84.58 Calculating the median is easy (forget the book’s formula on page 67): If there are an odd number of scores, then the median is the middle number. If there are an even number, then the median is the average of the middle two. Example: Find the median of this sample of 7 numbers: 5,3,1,6,2,8,3 Reorder: 1,2,3,3,5,6,8. The median is 3. Ice Dancing , compulsory dance scores, 2010 Winter Olympics
mean: the sum of all scores divided by the total number of scores. Using mathematical symbols: mx: mean of a population of scores (pronounced ‘mu of x’) : mean of a sample of scores (pronounced ‘x bar’) n: the number of scores in a sample N: the number of scores in a population Xi: the ith number in a sample’ S: means to add (sigma) Which we shorten to: The sample mean is: The population mean is:
Example: find the mean of this sample of 7 numbers: 5,3,1,6,2,8,3 X1 = 5, X2 = 3, X3 = 1, X4 = 6, X5 = 2, X6 = 8, X7 = 3
Fun facts about the mean -The mean is affected by all numbers in the sample (unlike the mode or median) -The mean is the value that makes From the example above: -Multiplying all scores by a number multiplies the mean by that same number -Adding a number to all scores adds the same number to the mean. -The mean is the ‘balance’ point of a distribution. 1 2 3 4 5 6 7 8
More stuff about the median and mean The median is not sensitive to outliers: Median of 1,2,4,5, and 10000 is 4. The mean is 2002.4 For a skewed distribution, the mean is pulled toward the tail compared to the median Median=705 Mean=683.9 40 35 30 25 Frequency 20 15 10 5 0 325 375 425 475 525 575 625 675 725 775 If a distribution is ‘symmetric’ (like a normal distribution), then the mean and median are the same. GRE quant scores
Medians are usually reported for income because of the positive skew in the distribution Bottom 98% of US household income (2005) http://www.visualizingeconomics.com/wp-content/uploads/2005_income_distribution.gif
Reaction times are a classic example of a skewed distribution in psychology 200 Mean: 160.2 Median: 154.2 180 160 140 120 Frequency 100 80 60 40 20 0 50 100 150 200 250 300 350 Reaction time (msec)