Download
1 / 11
110 likes | 223 Vues
The Structure, Amplitude, Location (SAL) method, developed by researchers at the University of Mainz and MeteoSwiss, provides a framework for evaluating the quality of quantitative precipitation forecasts (QPF). It quantifies three independent components: structure (S), amplitude (A), and location (L) of precipitation in a defined area, such as a river catchment. Using gridded precipitation data from ECMWF and COSMO-LM alongside observational datasets, the SAL method aims for perfect forecasts when S, A, and L equal zero. This approach enhances our understanding of forecast accuracy in meteorological assessments.

E N D
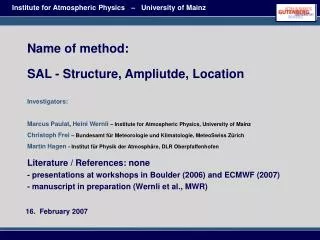
Institute for Atmospheric Physics – University of Mainz Name of method: SAL - Structure, Ampliutde, Location Investigators: Marcus Paulat, Heini Wernli– Institute for Atmospheric Physics, University of Mainz Christoph Frei– Bundesamt für Meteorologie und Klimatologie, MeteoSwiss Zürich Martin Hagen- Institut für Physik der Atmosphäre, DLR Oberpfaffenhofen Literature / References: none - presentations at workshops in Boulder (2006) and ECMWF (2007) - manuscript in preparation (Wernli et al., MWR) 16. February 2007
Marcus Paulat Christoph Frei Martin Hagen Heini Wernli What kind of data? • only gridded data • fields: so far only precipitation, in principle also applicable to other fields with well-structures signatures (e.g. wind gusts) • presently used FC data: ECMWF and COSMO-LM precipitation forecasts (accumulated over 1 or 24 h) over Germany on rotated lon/lat grid with 7 km horizontal resolution • presently used OBS data: gridded rain gauge data set on same grid as models, based upon ~4000 stations with 24 h values; 1-h disaggregated fields through combination of rain gauge and radar data
Marcus Paulat Christoph Frei Martin Hagen Heini Wernli Basic strategy (I): General concept • consider precipitation in pre-specified area (e.g. river catchment) • SAL consists of three independent components • components address quality of structure (S), amplitude (A) and location (L) of QPF in that area • according to SAL a forecast is perfect if S = A = L = 0 • S requires the definition of precipitation objects, using a threshold value • but: no attribution between precipitation objects in forecast and observations!
Marcus Paulat Christoph Frei Martin Hagen Heini Wernli Basic strategy (II): Definition of the components A = (D(Rmod) - D(Robs)) / 0.5*(D(Rmod) + D(Robs)) D(…) denotes the area-mean value (e.g. catchment) normalized amplitude error in considered area A [-2, …, 0, …, +2] L = |r(Rmod) - r(Robs)| / distmax r(…) denotes the centre of gravity of the precipitation field in the area normalized location error in considered area L [0, …, 1] S = (V(Rmod*) - V(Robs*)) / 0.5*(V(Rmod*) + V(Robs*)) V(…) denotes the weighted volume average of all scaled precipitation objects in considered area normalized structure error in considered area S [-2, …, 0, …, +2]
Marcus Paulat Christoph Frei Martin Hagen Heini Wernli Basic strategy (III): The S component scaling for every object: R* = R / Rmax; R* [Rthresh/Rmax, …, 1] R R* Rmax 1 Rthresh Rthresh/Rmax x x V(R*) V(R) circular precipitation object
Marcus Paulat Christoph Frei Martin Hagen Heini Wernli Basic strategy (IV): Example 1 R R* Rmax 1 OBS V(R*) x x R R* 1 MOD Rmax V(R*) x x S = 0 A < 0
Marcus Paulat Christoph Frei Martin Hagen Heini Wernli Basic strategy (V): Example 2 R R* Rmax 1 OBS V(R*) x x R R* 1 MOD Rmax V(R*) x x S > 0 A = 0
S A L - statistics: 24h accumulated summer seasons 2001-2004 for catchment Rhine aLMo ECMWF 2 1 A-component 0 -1 -2 -2 -1 0 1 2 -2 -1 0 1 2 S-component S-component Marcus Paulat Christoph Frei Martin Hagen Heini Wernli
Marcus Paulat Christoph Frei Martin Hagen Heini Wernli Kind of verification information / Verification questions • 3 independent components to quantify quality of structure, amplitude and location of QPF • information is valid for a pre-specified area (e.g. river catchment, state, field campaign area, …) • questions: • - is the domain averaged precipitation amount correctly forecast? -> A • - is the centre of the precipitation distribution in the domain correctly forecast? -> L • - does the forecast capture the typical structure of the precipitation field • (e.g. large broad vs. small peaked objects)? -> S
Marcus Paulat Christoph Frei Martin Hagen Heini Wernli Strength • physically meaningful information about amplitude, location and structure of QPF • relatively intuitive • SAL approach is close to “subjective human judgement” (claim) • no attribution between objects is required (difficult for small objects) • computationally simple
Marcus Paulat Christoph Frei Martin Hagen Heini Wernli Weaknesses and limitations • non-perfect QPFs can yield S = A = L = 0 (slight modification of L component is underway) • no consideration of orientation of objects • currently very simple definition of objects (threshold value) • S value is sensitive to choice of threshold used for object definition (tests are underway to quantify sensitivity) • so far only preliminary results for Germany have been computed