Monitoring the Safety Net: Advancing Vulnerable Populations' Healthcare
Explore the importance of monitoring safety net performance for optimal health outcomes among vulnerable populations, utilizing administrative data to identify preventable hospitalizations and ED visits. Understand the causes of variation in ACS rates and ED use across different regions.

Monitoring the Safety Net: Advancing Vulnerable Populations' Healthcare
E N D
Presentation Transcript
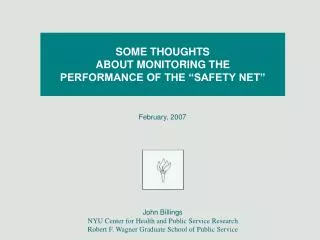
SOME THOUGHTS ABOUT MONITORING THE PERFORMANCE OF THE “SAFETY NET” February, 2007 John Billings NYU Center for Health and Public Service Research Robert F. Wagner Graduate School of Public Service
WHAT I’M GOING TO TALK ABOUT • Why the focus on “performance” of the safety net? • Some caveats and definitions • Some assumptions • Some examples of using administrative data to monitor performance • The limitations of using administrative data • A few suggestions (unsolicited advice)
SOME CAVEATS AND DEFINITIONS • The focus of policy should be on: Assuring optimal health for vulnerable populations • We need to worry about the resources required to assure optimal health of vulnerable populations • These resources are the “safety net” • Because resources are limited, it makes sense to examine the performance of this “safety net” • But it is important to remind ourselves that this isn’t really a “safety net” • We are flying without a net • No one is particularly safe
SOME ASSUMPTIONS • Texas is unlikely to enact a universal coverage initiative this year, or next year, or the year after that… • There are lots of opportunities to improve health of vulnerable populations in addition to buying coverage or subsidizing care • Therefore, it is critical to have a monitoring capacity • There is probably not a lot of money around for monitoring things • But it is critical to recognize the inherent limits of administrative data
Preventable/Avoidable HospitalizationsAmbulatory Care Sensitive (ACS) Conditions • Conditions where timely and effective ambulatory care help prevent the need for hospitalization • Chronic conditions – Effective care can prevent flare-ups (asthma, diabetes, congestive heart disease, etc.) • Acute conditions – Early intervention can prevent more serious progression (ENT infections, cellulitis, pneumonia, etc.) • Preventable conditions – Immunization preventable illness
ACS Admissions/1,000By Zip Code Area Income New York City - Age 18-64 - 2004 Adms/1,000 R2 = .622 LowInc/HiInc = 3.65 Coef Vari = .536 Mean Rate = 16.08 Each represents a zip code Percent of Households with Income <$15,000 Source: NYU Center for Health and Public Service Research
NYU EMERGENCY DEPARTMENTCLASSIFICATION ALGORITHM 1.0 Not preventable/avoidable ED Care Needed Preventable/avoidable Emergent Primary Care Treatable Non-Emergent
New York CityED Utilization ProfileAdults Age 18-64 - 1998 Source: NYU Center for Health and Public Service Research - UHFNYC
UNDERSTANDING THE CAUSES OFVARIATION IN ACS RATESAND ED USE • Theory 1: It’s just New York City • [Who cares] • [You’re more or less a different country]
ACS Admissions/1,000By Zip Code Area IncomeBaltimore - Age 18-64 - 1999 R2 = .899 LowInc/HiInc = 3.90 Mean Rate = 16.93 Source: NYU Center for Health and Public Service Research
ACS Admissions/1,000By Zip Code Area IncomeSt. Louis - Age 18-64 - 1999 R2 = .870 LowInc/HiInc = 3.50 Mean Rate = 12.53 Source: NYU Center for Health and Public Service Research
ACS Admissions/1,000By Zip Code Area IncomeMemphis - Age 18-64 - 1999 R2 = .887 LowInc/HiInc = 2.95 Mean Rate = 14.45 Source: NYU Center for Health and Public Service Research
ACS Admissions/1,000By Zip Code Area IncomeSan Diego - Age 18-64 - 1999 R2 = .650 LowInc/HiInc = 3.09 Mean Rate = 7.16 Source: NYU Center for Health and Public Service Research
ACS Admissions/1,000By Zip Code Area IncomeHOUSTON MSA - Age 18-64 - 2002 R2 = .561 LowInc/HiInc = 2.71 Mean Rate = 14.57 Source: NYU Center for Health and Public Service Research
ACS Admissions/1,000By Zip Code Area IncomeDenver - Age 18-64 - 2002 R2 = .709 LowInc/HiInc = 2.61 Mean Rate = 9.10 Source: NYU Center for Health and Public Service Research
ACS Admissions/1,000By Zip Code Area IncomePortland, OR - Age 18-64 - 1999 R2 = .739 LowInc/HiInc = 4.26 Mean Rate = 7.69 Source: NYU Center for Health and Public Service Research
SOUTH CAROLINAED Utilization ProfileAdults Age 18-64 - 1997 Source: NYU Center for Health and Public Service Research
Preventable/Avoidable ED Use/1,000By Zip Code Area Income Austin Metro Area - Age 0-17 - 2000 Austin Metro Area
UNDERSTANDING THE CAUSES OFVARIATION IN ACS RATESAND ED USE • Theory 1: Who cares? It’s just New York • Theory 2: It’s really pretty complicated • Coverage barriers • Resource supply/capacity • Economic barriers • Provider performance • Quasi-economic barriers • Transportation • Child care • Lost wages • Barriers to social care • Limitations in community social capital • Limitations in personal social capital • Education, motivation, confidence, health beliefs • Physician practice style (Wennberg et al), etc, etc
ACS Admissions/1,000Zip 10016 and Citywide RatesNew York City - Age 0-17 – 1982-2001 Adms/1,000 New York City Zip 10016 Source: SPARCS - NYU Center for Health and Public Service Research - UHFNYC
ACS Admissions/1,000By Zip Code Area Income New York City - Age 18-64 - 2002 Adms/1,000 R2 = .622 LowInc/HiInc = 3.65 Coef Vari = .536 Mean Rate = 16.08 Each represents a zip code Percent of Households with Income <$15,000 Source: NYU Center for Health and Public Service Research
ACS Admissions/1,000By Zip Code Area IncomeMiami - Age 18-64 - 1999 R2 = .330 LowInc/HiInc = 1.89 Mean Rate = 14.82 Each represents a predominantly Cuban-American zip code Source: NYU Center for Health and Public Service Research
ACS Admissions/100,000By Ward Code and Deprivation IndexLondon, UK - Age 15-64 - 2001/2-2002/3 R2 = .387 HighDI/LowDI = 2.10 Mean Rate = 881.0 Each “♦” represents a ward Note: All data are for 2001/2 and 2002/3
ACS Admissions/1,000Low and High Income AreasAdmissions Per 1,000New York City MSA – Age 40-64 Adms/1,000 Low Income Areas High Income Areas Source: NYU Center for Health and Public Service Research
ACS Admissions/1,000Low and High Income AreasAdmissions Per 1,000New York City – Age 0-17 Adms/1,000 $50,000,000 Low Income Areas High Income Areas Source: NYU Center for Health and Public Service Research
WHAT’S GOING ON HERE? • It’s an improvement in clinical medicine (e.g., asthma) • Changes in composition of NYC’s low income population • It’s related to changes in the factors that contribute to health disparities • Coverage expansion (???) • Supply expansion (???) • Service improvement: greater “competition for patients” • Changes in social context • Etc, etc, etc… • 1. It isn’t anything 2. It is something:
Change in ED Visits/1,000New York CityMedicaid FFS – ADC/HR Girls Age 6mos-14yrs1994-1999 % Change (Log Scale) +100% - +50% - +25% - Injuries -20% - Asthma -33% - ACS - No Asthma -50% - Source: NYU Center for Health and Public Service Research
Change in Percent of ED Visits Resulting In Admission New York City Medicaid FFS – ADC/HR Girls Age 6mos-14yrs1994-1999 % Change (Log Scale) +100% - +50% - +25% - Asthma ACS - No Asthma -20% - Injuries -33% - -50% - Source: NYU Center for Health and Public Service Research
ACS Admissions/1,000Low Income AreasNew York MSAs - Age 0-17 Adms/1,000 New York City Syracuse Buffalo Rochester Source: NYU Center for Health and Public Service Research
ACS (W/o Asthma) Admissions/1,000Low Income AreasCalifornia MSAs and New York City - Age 0-17 Adms/1,000 New York City Oakland Los Angeles San Diego San Francisco Source: NYU Center for Health and Public Service Research
OUR APPROACH • We examined fee-for-service paid Medicaid claims • Patients are linked to their primary care provider • Linking based on primary care visits (not ED or specialty care) • Patients with 3+ primary care visits linked to provider having the majority of primary care visits [“predominant provider’] • Patients with fewer than 3 visits examined separately • Performance of providers for their patients is then examined
GETTING BEYOND ADMINISTRATIVE DATAIN MONITORING THE SAFETY NET
So If “Provider Performance” Matters…What Factors Influence “Provider Performance? • Hours of operation (?) • “Cycle time” (?) • Wait time for appointment (?) • Language barriers (?) • Doctor-patient interaction [respect, courtesy, communication] (?) • Staff-patient interaction [respect, courtesy, communication] (?) • Content of care: doctor skill (?) • Content of care: patient education on self-management (?) • Staffing mix (MD type, nurse practitioner, etc.) • Staffing mix (use of medical residents) • Patient “outreach” (?) • Easy telephone access (?) • MIS systems [notification that patient is in ED] (?) • Etc, etc, etc.
Factors That Matter to Patients“I Would Recommend This Place to My Friends” • Things that matter most • The facility is pleasant and clean • I saw the doctor I wanted to see • The office staff were respectful and courteous • The doctor was respectful and courteous • Things that matter somewhat • The office staff explained things in a way I could understand • The location is convenient for me • I waited a short time to see the doctor • It is easy to get an appointment when I need it • Things that don’t seem to matter as much • The doctor spent enough time with me • The doctor/nurse/office staff listened to me carefully • It is easy to get advice by telephone • The hours are convenient Source: NYU Center for Health and Public Service Research
FINDINGS FROM INTERVIEWS OFED PATIENTS • Most patients wait a considerable amount of time before heading to the ED • But they are unlikely to have contacted the health care delivery system before the visit • Convenience is the leading reason for ED use • Many are not well-connected to the health system Source: NYU/UHF survey of ED patients in 4 Bronx hospitals - 1999
FINAL THOUGHTS ABOUTMONITORING THE SAFETY NET • It is critical to know… • Are things getting better or worse? • What are the biggest problems? • Where are the biggest problems? • Support evidence-based policy making - Use data to: • Identify the areas and populations in greatest need • Understand the nature and characteristics of that need • Assess impact of interventions • Learn from natural experiments • Get answers for some of things we don’t know • Oh, and talk to patients once in a while • They know what they want better than you do • It is important to understand what’s driving their use patterns