Download
1 / 25
250 likes | 359 Vues
This study presents an analytical model for the TCP Reno protocol that explicitly incorporates Spurious Timeouts (ST) to improve performance in wireless mobile environments, which experience more frequent delay spikes than traditional wired networks. By analyzing the relationship between packet error rates, delay characteristics, and TCP performance, the proposed model enhances the accuracy of steady-state sending rates and throughput predictions. Furthermore, it compares the results with previous TCP performance models and offers insights into optimizing TCP settings in the presence of ST.

E N D
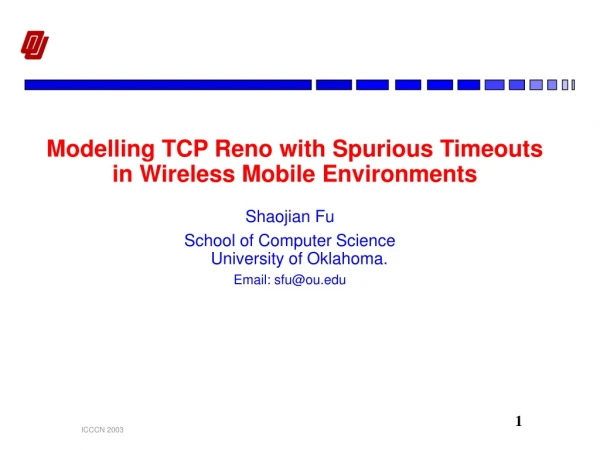
Modelling TCP Reno with Spurious Timeouts in Wireless Mobile Environments Shaojian Fu School of Computer ScienceUniversity of Oklahoma. Email: sfu@ou.edu
Introduction • Delay spikes are especially more frequent in today's wireless mobile networks than in traditional wired network, which will cause Spurious Timeouts (ST). • Previous studies on Modelling TCP performance over wireless networks focus on the impact of wireless random losses. • Spurious Timeouts must be considered explicitly to accurately model the steady state sending rate and throughput of TCP. • Proposed an analytical model for the sending rate and throughput of TCP Reno as a function of packet error rate and characteristics of spurious timeouts.
Outline • The background on Delay Spike and Spurious Timeout provided. • Impact of this model on future transport protocol research. • Modelling assumptions. • Analytical model. • Validation of the model with simulation works. • Compare with previous model on TCP perfromance.
Round Trip Time Delay spikes Time Normal RTT Examples of Delay Spikes
Events causing delay spikes in wireless mobile environment • The handoff of a mobile host between cells requires the registration with the base stations. • The physical disconnection of the wireless link during a hard handoff. • Retransmission at Radio Link Control (RLC) layer, e.g. GPRS and CDMA2000. • Higher-priority traffic, such as circuit-switched voice, can preempt (block) the data traffic temporarily.
Sender’s congestion window Spurious Timeout Begin transmit new data
Previous models on TCP performance • Early TCP analytical models only consider slow start and congestion avoidance. • Recent models take into account the RTO timeout caused by random losses during transmission, such as the model proposed by Padhye et. al. (Referred as PFTK model in our paper). • Since Spurious Timeouts are not frequent in wired networks, they are considered to be a transient state, and thus cannot produce much impact on the steady state performance of TCP. • In wireless mobile environment, Spurious Timeouts are more frequent. They must be modelled explicitly to estimate the steady state performance of TCP more accurately.
A new analytical model considering the characteristics of Spurious Timeouts • Impacts of Spurious Timeouts are explicitly built into the analytical TCP performance model. • Stochastic analysis of the steady state sending rate and throughput of TCP Reno as a function of: • packet error rate, • interval between long delays, • duration of long delays. • The model proposed by Padhye et. al. (referred as PFTK model) can accurately predict TCP performance over a wide range of loss rates. We use this model as a basis of our work.
Possible application of the model • Fundamental trade off between the detection rapidness of actual losses versus the risk of unnecessary retransmissions: • small RTO: fast detection, more risk of spurious timeout; • large RTO: slow detection, less risky but long stall time. • RTOmin has significant impact on RTO value, common practice is set it to 2*clock. This model can assist in determining an appropriate value of RTOmin since it considers spurious timeouts explicitly. • Help evaluating the impact of lower layer protocols’ settings on the performance of TCP. • Help evaluating different TCP modifications designed for alleviating the effect of Spurious Timeout.
Modelling Assumptions • The sending rate is not limited by the advertised receiver window, and the sender always has sufficient data to send. • Segment losses in a round are independent from losses in other rounds. All other segments which were sent after the first lost segment in a specific round are also lost. • The time required to send a window of data is smaller than an RTT. • No RTT fluctuation measurements caused by queuing delays. In the absence of delay spikes, the RTT measurements compose a stationary random process.
Stochastic model of long delay pattern Variation of RTT showing delay spikes Markov Chain model
Steady-state Sending Rate Estimation • Consider LDC as the basis for steady state sending rate calculation, instead of using NP in PFTK model. • The proposed model considers a larger time scale than PFTK model: one LDC is composed of several NP and one LDP. • A high-level expression of the model:
Steady-state Throughput Estimation • Use the sending rate as the basis of throughput estimation. • Subtract dropped segments and multiple retransmitted segments for the same segment from total number of segments sent during NP. • Subtract dropped segments and spuriously retransmitted segments from total number of segments sent during LDP. • The duration of LDC unchanged for throughput estimation.
Simulation Setup Topology: Parameters:
Sending rate estimation comparison (200ms RTT) RTT=200ms E(I)=30s RTT=200ms E(I)=240s
Sending rate estimation comparison (400ms RTT) RTT=400ms E(I)=30s RTT=400ms E(I)=240s
Throughput estimation comparison (200ms RTT) RTT=200ms E(I)=30s RTT=200ms E(I)=240s
Throughput estimation comparison (400ms RTT) RTT=400ms E(I)=30s RTT=400ms E(I)=240s
Estimation error vs. LDF* Throughput estimation error Sending rate estimation error LDF = E(D)/E(I)
Estimation error vs. RTT Throughput estimation error Sending rate estimation error
Estimation error vs. packet error rate Throughput estimation error Sending rate estimation error
Conclusion • The proposed model can characterize the impact of delay spikes with different patterns on TCP’s performance. • The proposed model is more accurate than the PFTK model in estimating the steady state sending rate and throughput of TCP, especially in presence of frequent long delays. • Future research can be made on applying the model in TCP RTO setting selection or lower layer retransmission protocol design evaluation.