Download
1 / 38
380 likes | 515 Vues
This document outlines the key modifications, calibrations, and field tests conducted on Photoacoustic Spectrometers (PSAP) for measuring aerosol light absorption and extinction. It covers optics and electronics modifications, including adjustments in wavelength settings and light sources. The goal is to characterize existing instruments, quantify measurement uncertainties, and derive methods for spectral aerosol absorption analysis based on multi-wavelength data. Collaboration among NOAA, DRI, UW, NASA, and other institutions was crucial for achieving these objectives during the June 2002 study.

E N D
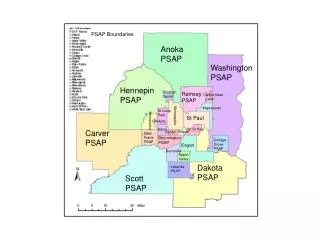
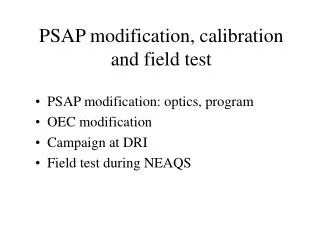
PSAP modification, calibration and field test • PSAP modification: optics, program • OEC modification • Campaign at DRI • Field test during NEAQS
Detector-weighted mean wavelengths: Blue: 471 nm, Green: 543 nm, Red: 659 nm
OEC L = 660 cm
OEC at DRI OEC at UW
Reno Aerosol Optics StudyJune, 2002 John Ogren NOAA/CMDL
Objectives • Characterize new and existing instruments for measuring aerosol light absorption and extinction • Quantify the uncertainty in the measurements of aerosol light absorption coefficient used by NOAA and ARM • Derive methods for determining spectral aerosol absorption from multi-wavelength measurements of absorption and (extinction - scattering)
Participants • NOAA/CMDL (Ogren, Sheridan) • DRI (Arnott, Moosmüller, Varma) • U. Washington (Covert, Virkkula, Ahlquist) • NASA/Ames (Strawa, Schmid) and Picarro Networks, Inc. (Owano, Provencal) • Thermo Andersen/DLR (Schloesser, Petzold) • Portland State U. (Atkinson)
Absorption Coefficient Measurements • Photoacoustic • #1 532 nm • #2 1047 nm • Filter-based • Particle/soot absorption photometer (PSAP) • #1: 565 nm • #2 460, 540, 660 nm • Aethalometer • #1 370, 470, 521, 590, 660, 880, 950 nm • #2 370, 430, 470, 521, 565, 700, 950 nm • Carusso (multi-angle) • #1: 670 nm
Extinction Coefficient Measurements • Folded path extinction cell (6.6 m path) • #1 460, 540, 660 nm • Cavity-ring down (CRD) • #1: 532 nm • #2: 690, 1550 nm • #3: 532, 1064 nm
Scattering Coefficient Measurements • TSI 3563 integrating nephelometer • #1 450, 550, 700 nm • Radiance M903 integrating nephelometer • #1: 530 nm • DRI integrating sphere nephelometer • #1: 532 nm • NASA/Ames CRD nephelometer • #1: 690 nm
EC & SC calculations 1) STP 2) Drift correction for EC 3) SC truncation correction, J.O. 4) SC interpolation to EC wavelengths: 5) Time shifts to match EC & SC data
Extinction by Gray Aerosols (532nm) Notes: Data points represent kerosene soot runs with varying amounts of ammonium sulfate. Scattering measured with TSI nephelometer, absorption with DRI photoacoustic instrument.
EC-SC vs PSAP, 1-min data, all experimentsPSAP data corrected according to Bond et al. (1999).
EC-SC vs PSAP, 1-min data, good experimentsPSAP data corrected according to Bond et al. (1999).
Looking for theloading correction function f(Tr), 1 When looking for f(Tr), use
Looking for theloading correction function f(Tr), 5 Vary interpolation wavelengths => minimizing yields different values for k0, k1 & g
PSAP response to white aerosol, 5 Is fit 3 worth the extra work?